
ControlUp has traditionally specialized—and is an industry leader in—monitoring and managing virtual desktops and the infrastructure on which they run. In 2021, we expanded our focus with the release of Edge DX, a solution for monitoring and managing physical endpoints.
For businesses, offering remote work options is no longer optional; it is now a business imperative. Knowledge workers now demand it and have said, plain and simple, that if flexible work options are not available, they’ll simply quit and work elsewhere.
Unfortunately, we have also seen an upswing of issues pertaining to the physical devices that distributed workers use. Yes, there are other products available to manage physical endpoint devices, but they tend to be overly complicated, don’t scale well, require corporate network and / or active directory connectivity, have limited management and reporting capabilities, and don’t fully support automation or mass-healing of devices. Edge DX was designed to mitigate these issues.
In this and an upcoming blog, I will focus on these last points: reporting on devices and, in particular, how you can extend the reporting function on Edge DX using scripts to gather and place additional information in the Edge DX database.
ControlUp for Desktops Architecture
ControlUp for Desktops is cloud-based and its architecture is straightforward and uncomplicated; an agent runs on an endpoint device and relays information back to the ControlUp Cloud platform over an HTTP port. The agent supports endpoints that run Windows, Linux, macOS, Stratodesk, IGEL and other OSes on Arm and x64 platforms.
This architecture lends itself to reporting, automation, and mass-healing as the data from the agent is stored and manipulated in the cloud and actions can be pushed back to the devices. To support this, Edge DX supports scripting on any of the OSes it supports, as well as a wide variety of scripting languages for those OSes. Scripts can be used to correct issues on the devices or gather more information.
Here, we’ll look at how to create a custom report from information stored in Edge DX’s database. In a follow-on blog, we’ll show you how to create a script to gather information from a device, store it in Edge DX’s database, and then retrieve it from the database.
Accessing the ControlUp for Desktops Database
Edge DX has a powerful, highly performant database that, by default, collects hundreds of metrics from the devices it monitors. You can use this data to create custom reports. For example, if you are doing a hardware refresh of your devices and want a report that lists their RAM, CPU count, and battery health, you can quickly and easily create a report using Edge DX.
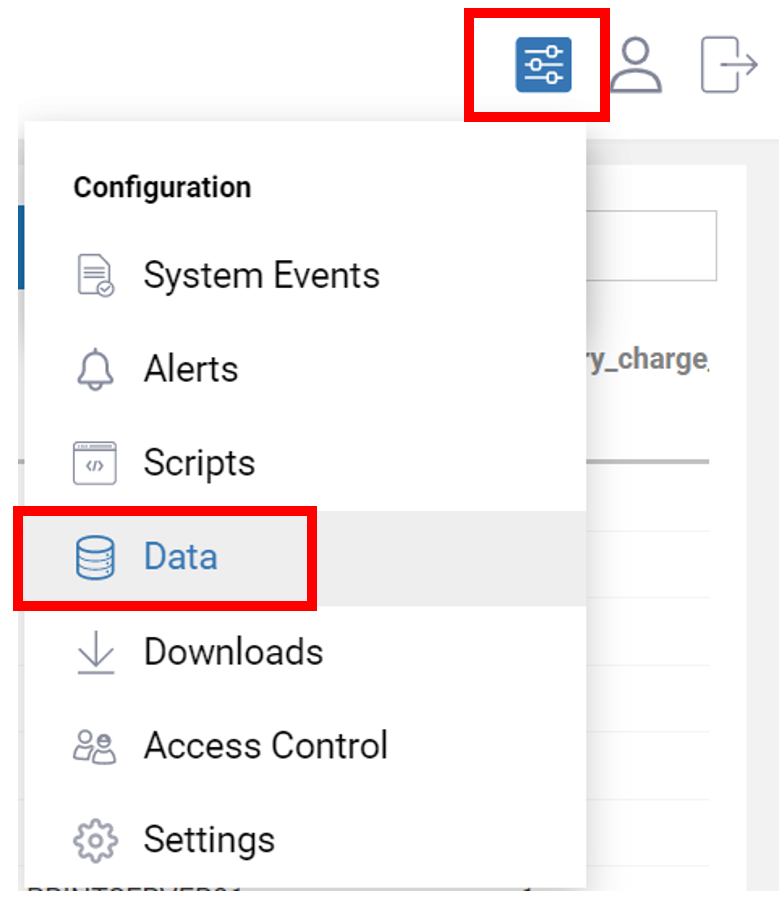
Select Data from the Configuration drop-down menu.
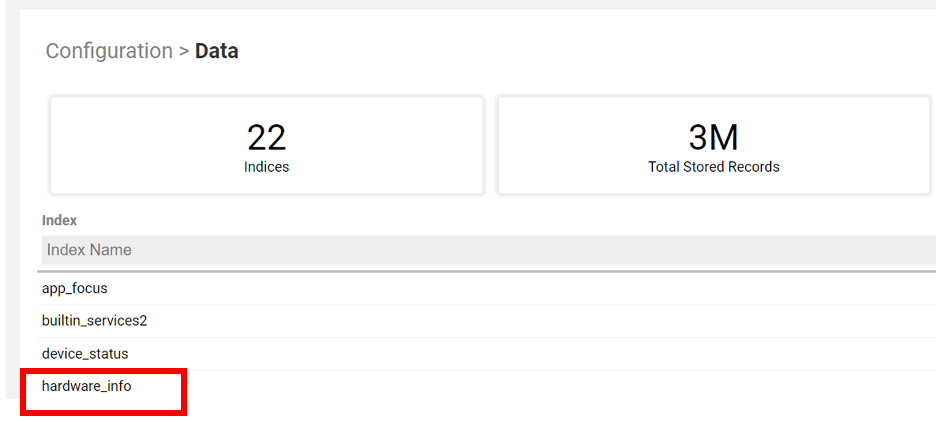
This will bring up a list of the database indices. The names of the indices should be self-descriptive. In our case, we want the hardware information of the devices, so select hardware_info.
This will bring up a list of the database indices. The names of the indices should be self-descriptive. In our case, we want the hardware information of the devices, so select hardware_info.
From the Index Schema list, select battery_charge_remaining, device_name, manufacturer, model, physical_memory_bytes and physical_processor_core_count. The names that start with an underscore (“_”) were created by Edge DX automatically; that will limit the information displayed in those fields.
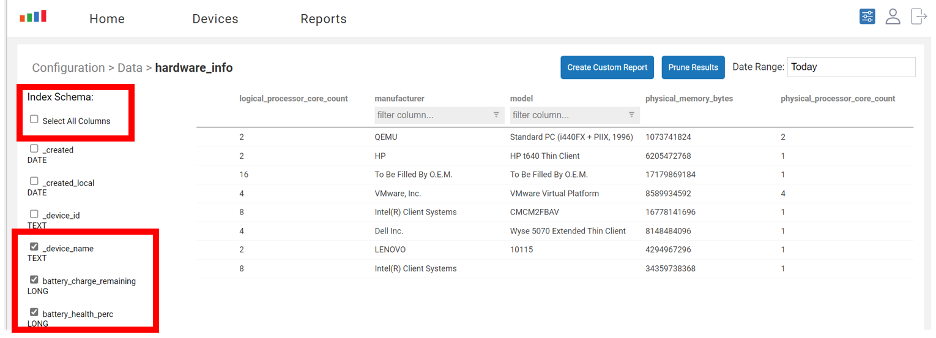
If you don’t see the schema list, verify that you have the correct RBAC permissions. This can be found in Settings > Configuration > Access Control under Configuration > Data.
If you want to run this report later, you can click Create Custom Report, give the report a name and description, click the Publish checkbox, then click create.
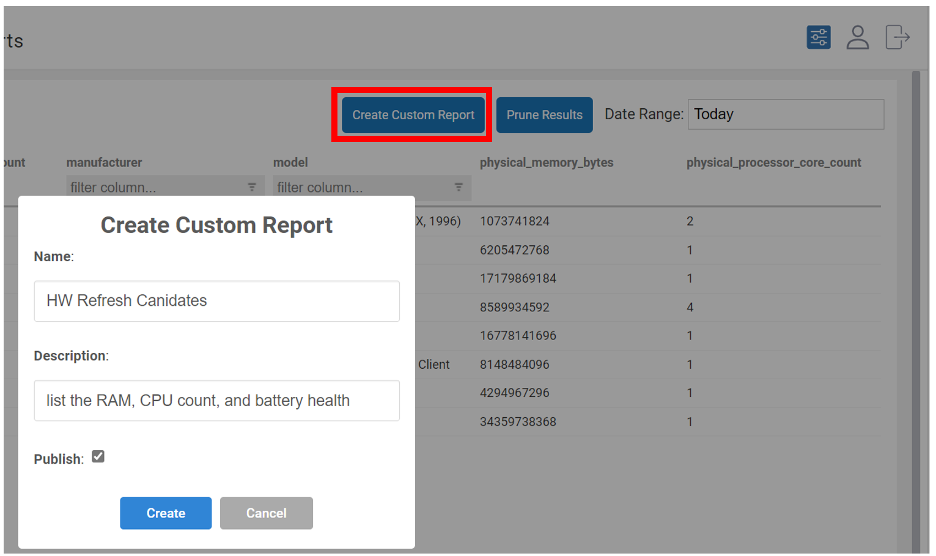
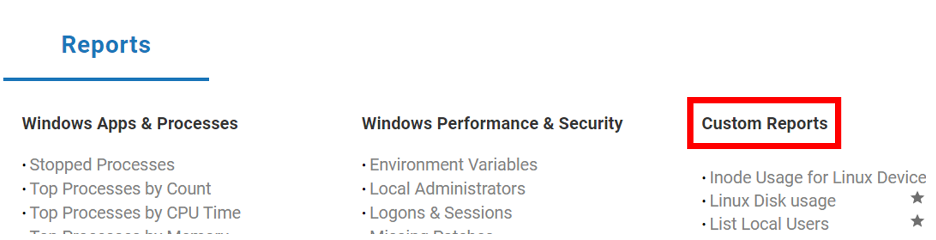
Now, whenever you want to run the report, you can select it using the reports tab. The report will be under Custom Reports.
Because of Edge DX’s open nature, you can pull myriad information about your devices from the database. This article only touched on its power, but by using scripts, you can collect additional information from these devices, create reports from that information, and then run those reports on a schedule. In my next blog, I will show you how to do just that.