
Introduction
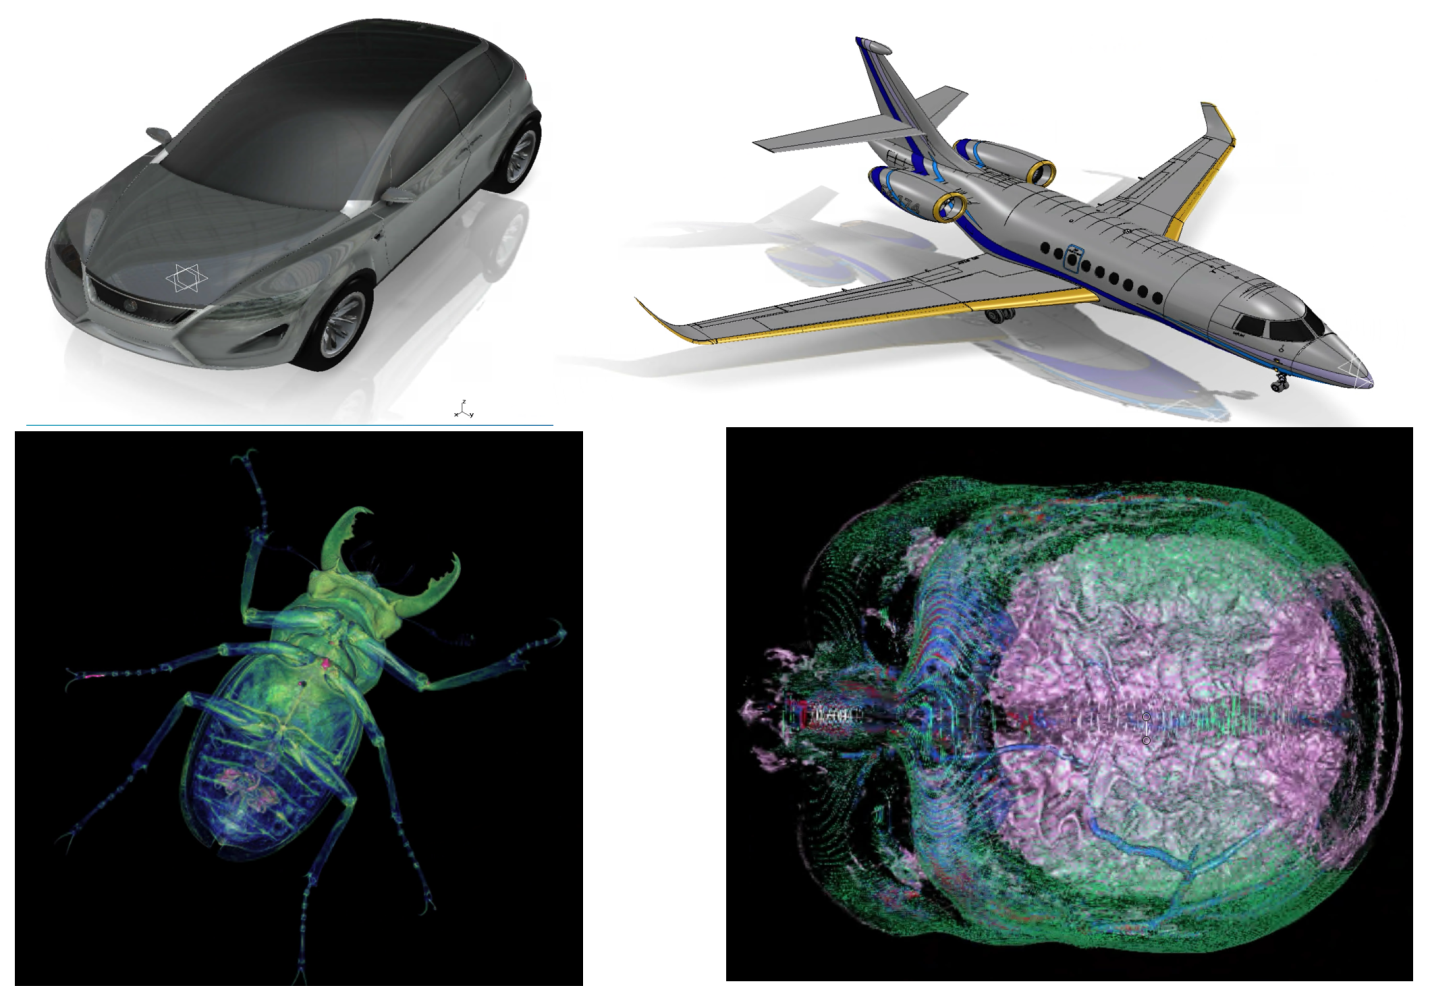
Virtual desktops are becoming more common in firms within industries like engineering, medical, and entertainment, where users view and process visual images or video – and need the power of a graphics processing unit (GPU) to accomplish their daily tasks. Fortunately, modern virtual desktop infrastructures (VDI), such as VMware Horizon, support virtual desktops with graphic cards. GPUs can either be dedicated to a specific virtual desktop or shared between multiple desktops, with shared cards being the most popular option. As these cards are an expensive and scarce resource, they must be monitored to ensure that they are being used as efficiently as possible.
In this article, I will give a brief overview of using GPUs in virtual desktops and the setup that I used with my GPU. Then, I will explain how to monitor GPU usage using the ControlUp Console and tell you about a couple of gotchas that I discovered when I first tried to use ControlUp with GPU-enabled desktops.
VMware Horizon has various technologies to allow GPUs to be used by virtual desktops, the most common of which being Virtual Shared Passthrough Graphics Acceleration, which is what I used when I wrote this article. In order to use it, you must first install a vSphere Installation Bundle (VIB) on the ESXi host and a vendor driver on the virtual desktops. This allows graphics commands to be passed directly to the GPU without first having to be translated by the hypervisor.
Setup
The GPU environment that I used for this article consisted of a Wyse VDI client, a NVIDIA GPU, and a VMware Horizon virtual desktop running on a local server.
The VDI client was a Wyse 5070 equipped with an Intel Pentium Silver J5005 CPU, 8 GB DDR4 RAM, Intel UHD Graphics 605, an AMD Radeon 9173 PCI-e graphics card in the extended chassis, and a 64GB SSD drive. Windows 10 Enterprise 2016 LTSB 64-bit was also preinstalled on the device. This VDI client can have up to 6 monitors attached to it, but for this article I attached a single 4K monitor.

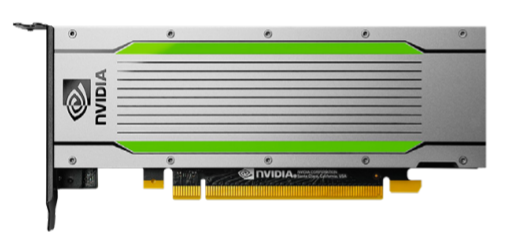
The GPU I used was an NVIDIA Turing T4 GPU with 320 Turing Tensor Cores and 16 GB of GDDR6 RAM. The T4 connects to the server via a x16 PCIe Gen3 interface, and is capable of 65 TFLOPS of mixed-precision (FP16/FP32) calculations and of handling the most demanding of VDI workloads.
The ESXi host I used was a Dell PowerEdge R740xd with two Intel Xeon Gold 6248 CPU @ 2.50GHz, 256GB of DDR4 2667MHz RAM, and with the NVIDIA Turing T4 GPU installed in it. For persistent storage for the virtual desktop, I used a single SSD-based datastore which was directly attached to the server. The server had VMware ESXi 6.7U1 installed on it and was being managed by a 6.7 vCenter server.
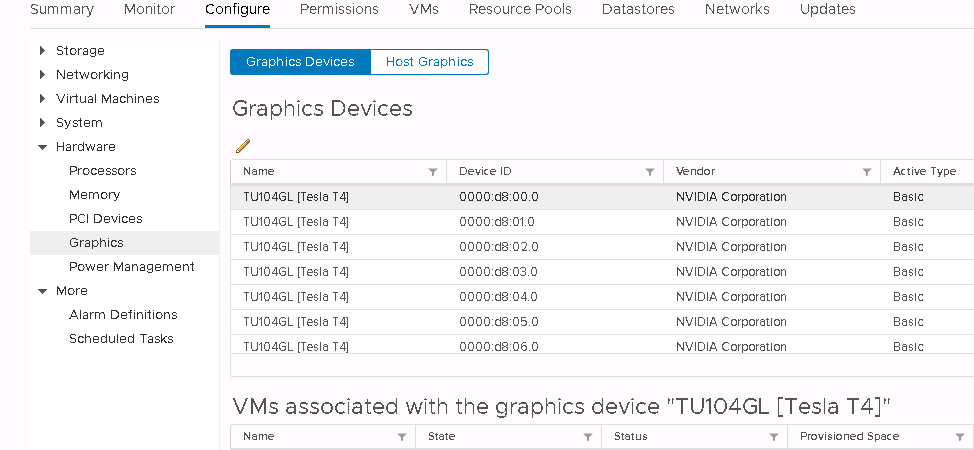
To verify that the T4 was installed and configured correctly, I examined it with the vSphere Web Client.
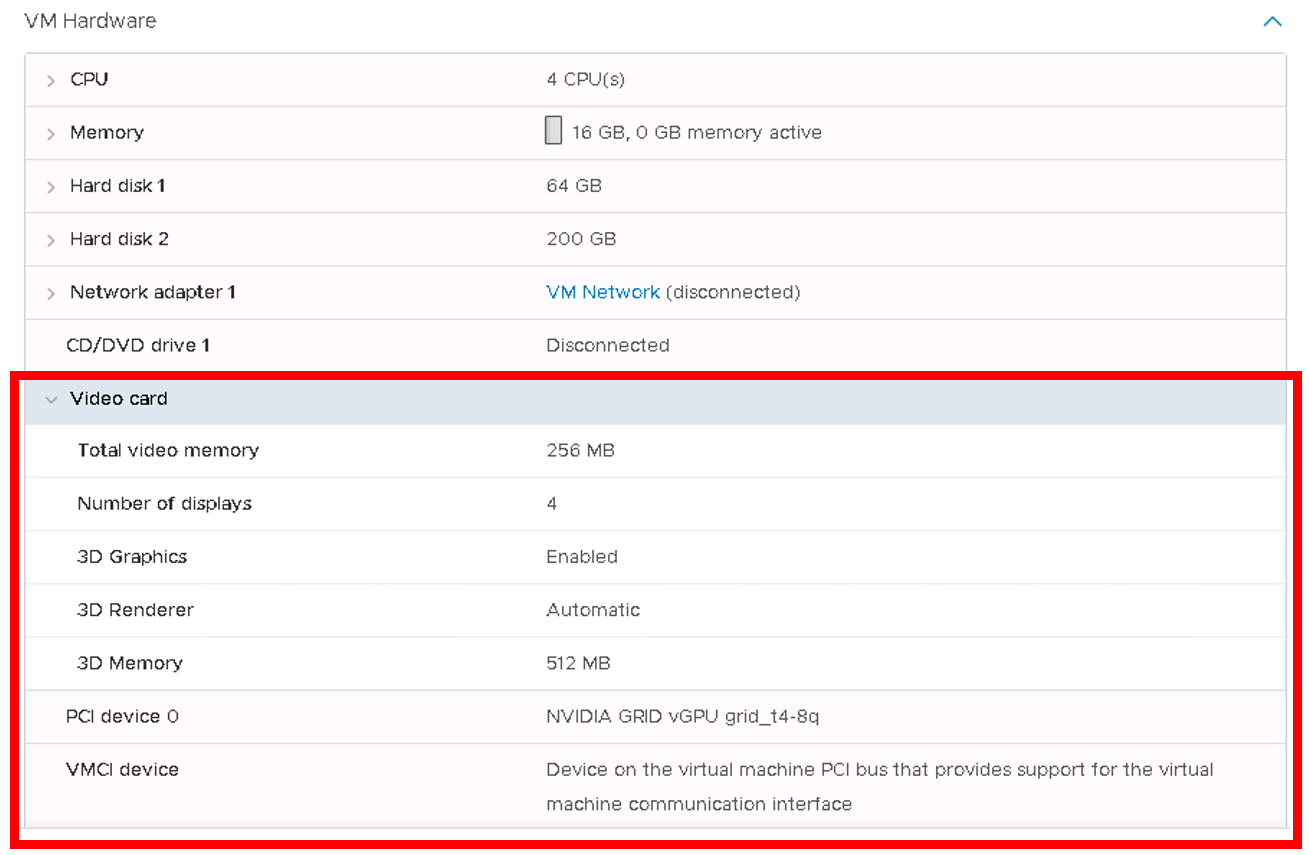
The virtual desktop was running Windows 10, and had 4 vCPUs, 16 GB of RAM, a 64 and 200 GB virtual disk. The T4 GPU attached to it had 256 MB of video memory and 512 MB of 3D memory.
Monitoring GPU Using the ControlUp Console
One of great things about using ControlUp to monitor GPU activity on a virtual desktop is that you don’t need to install or enable anything extra; as long as you have the CUp agent running, you will be able to see the GPU information.
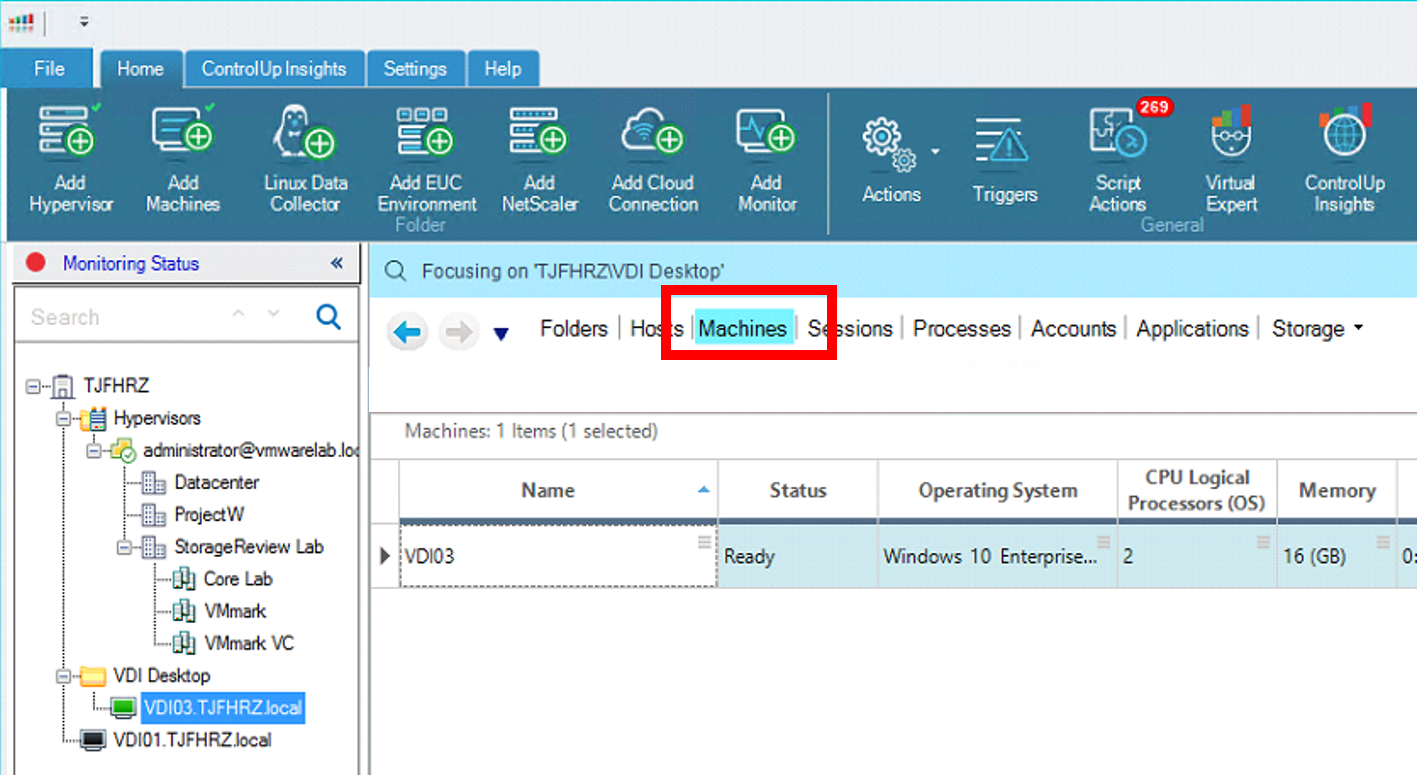
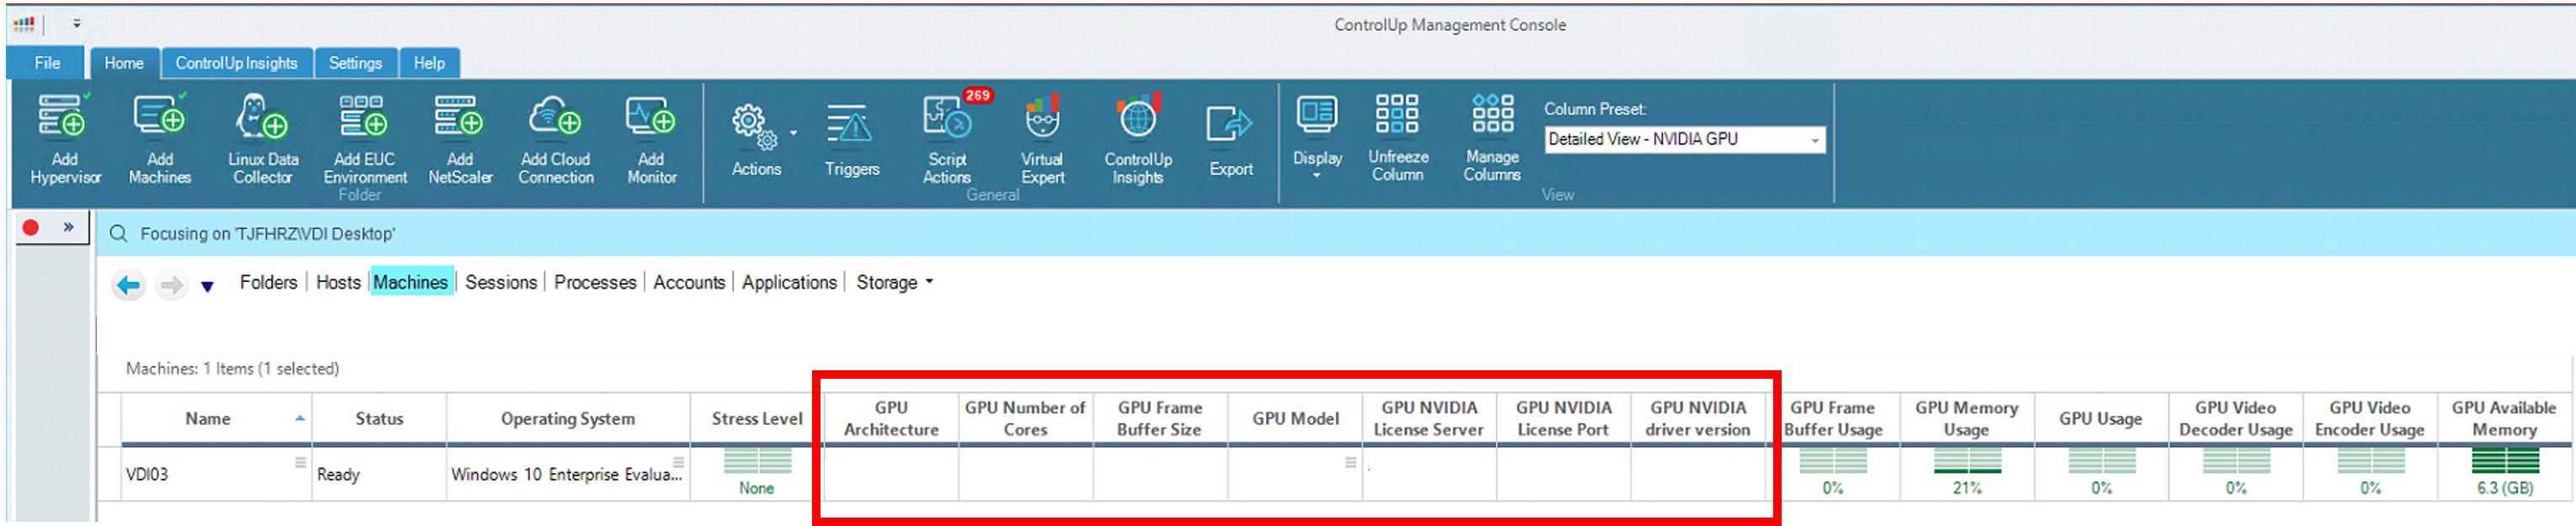
To get to a ControlUp information grid that shows GPU metrics, double-click on a virtual desktop or a folder with GPU-enabled desktops, and select the Machines tab from the navigation bar.
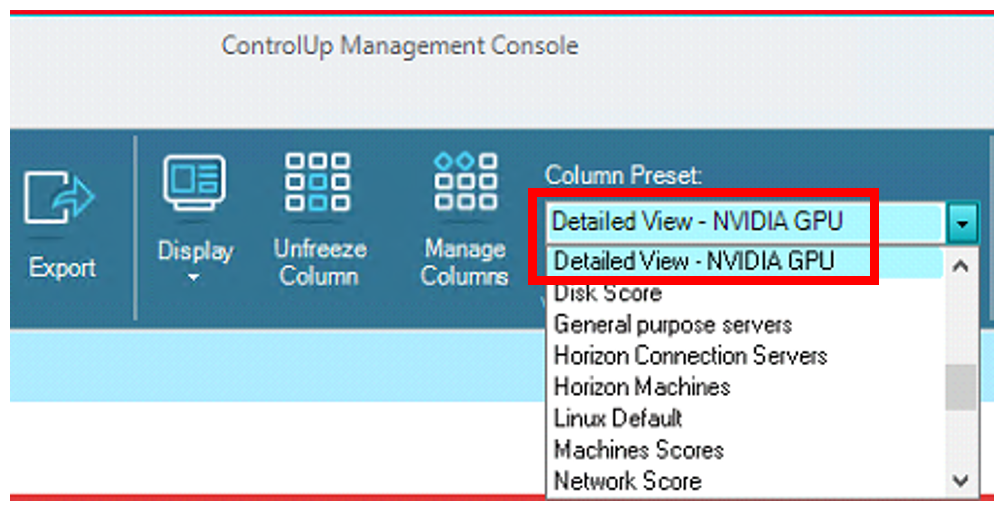
Although the default view doesn’t display any GPU information, you can configure it to do so by selecting Detailed View – NVIDIA GPU from the Column Presets drop-down menu on the ribbon bar.
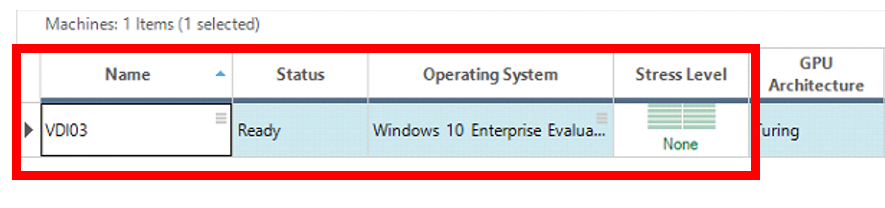
The information grid will now show information about the GPU. The grid’s left section shows general information about the virtual desktop.
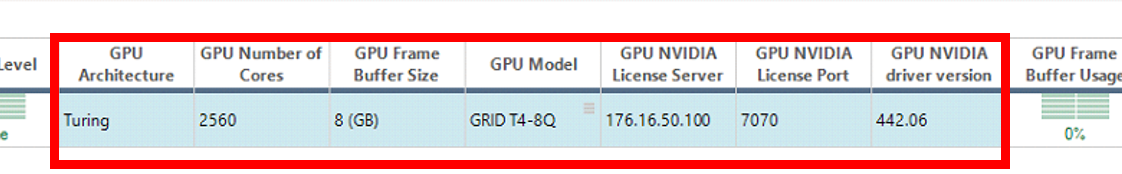
The middle section on the grid shows information about the GPU and its license server.
The right section of the grid shows information about GPU usage on the virtual desktop.

Viewing GPU Processes
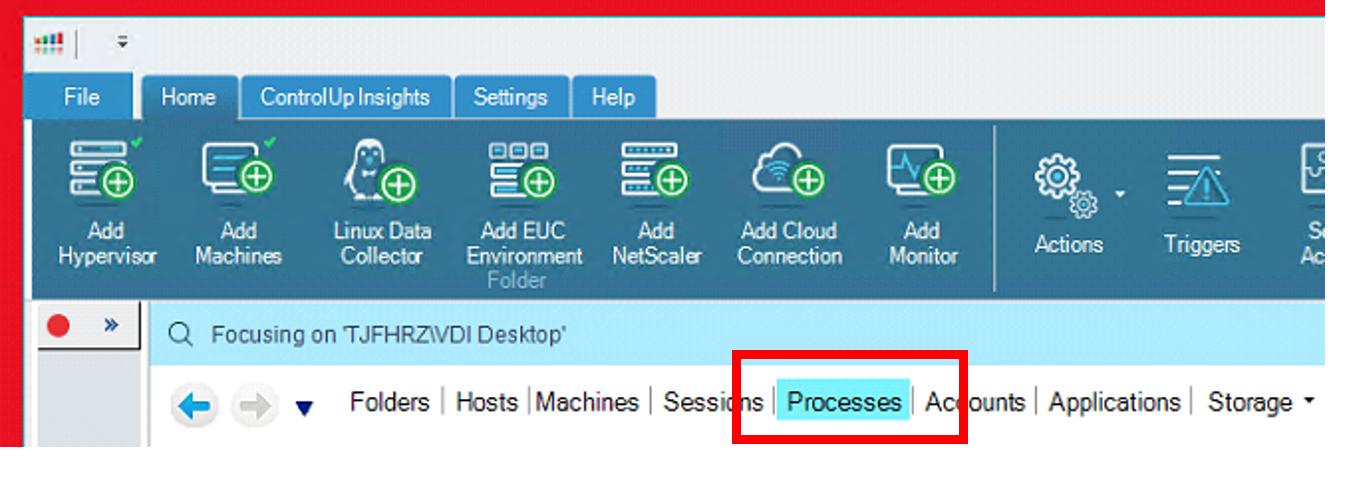
Not only can you see the overall GPU activity on a virtual desktop, but you can also dive in further and see what specific processes are consuming the GPU. To do this, select the Processes tab from the navigation bar.
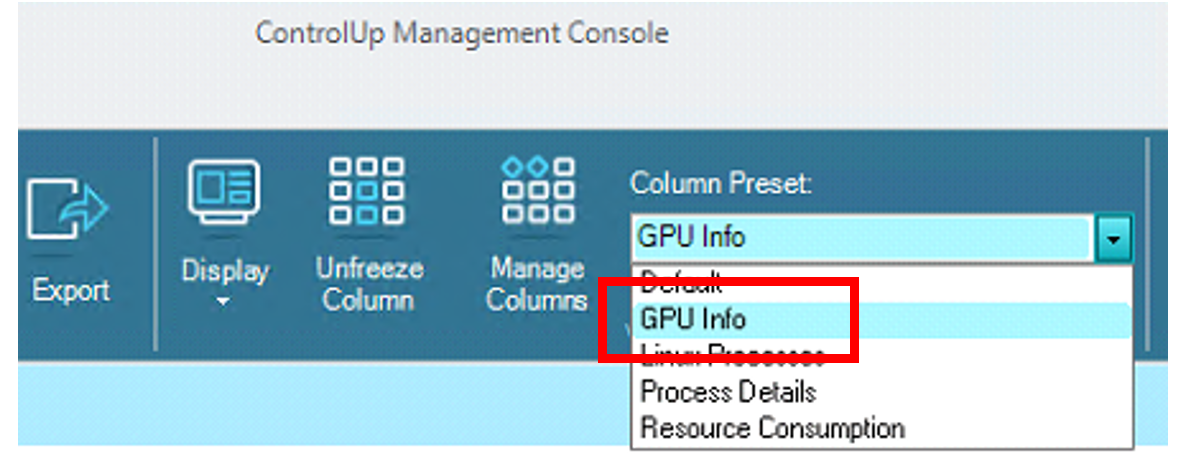
Again, the default view doesn’t display any GPU information, so you will need to select GPU Info from the Column Presets drop-down menu on the ribbon bar.
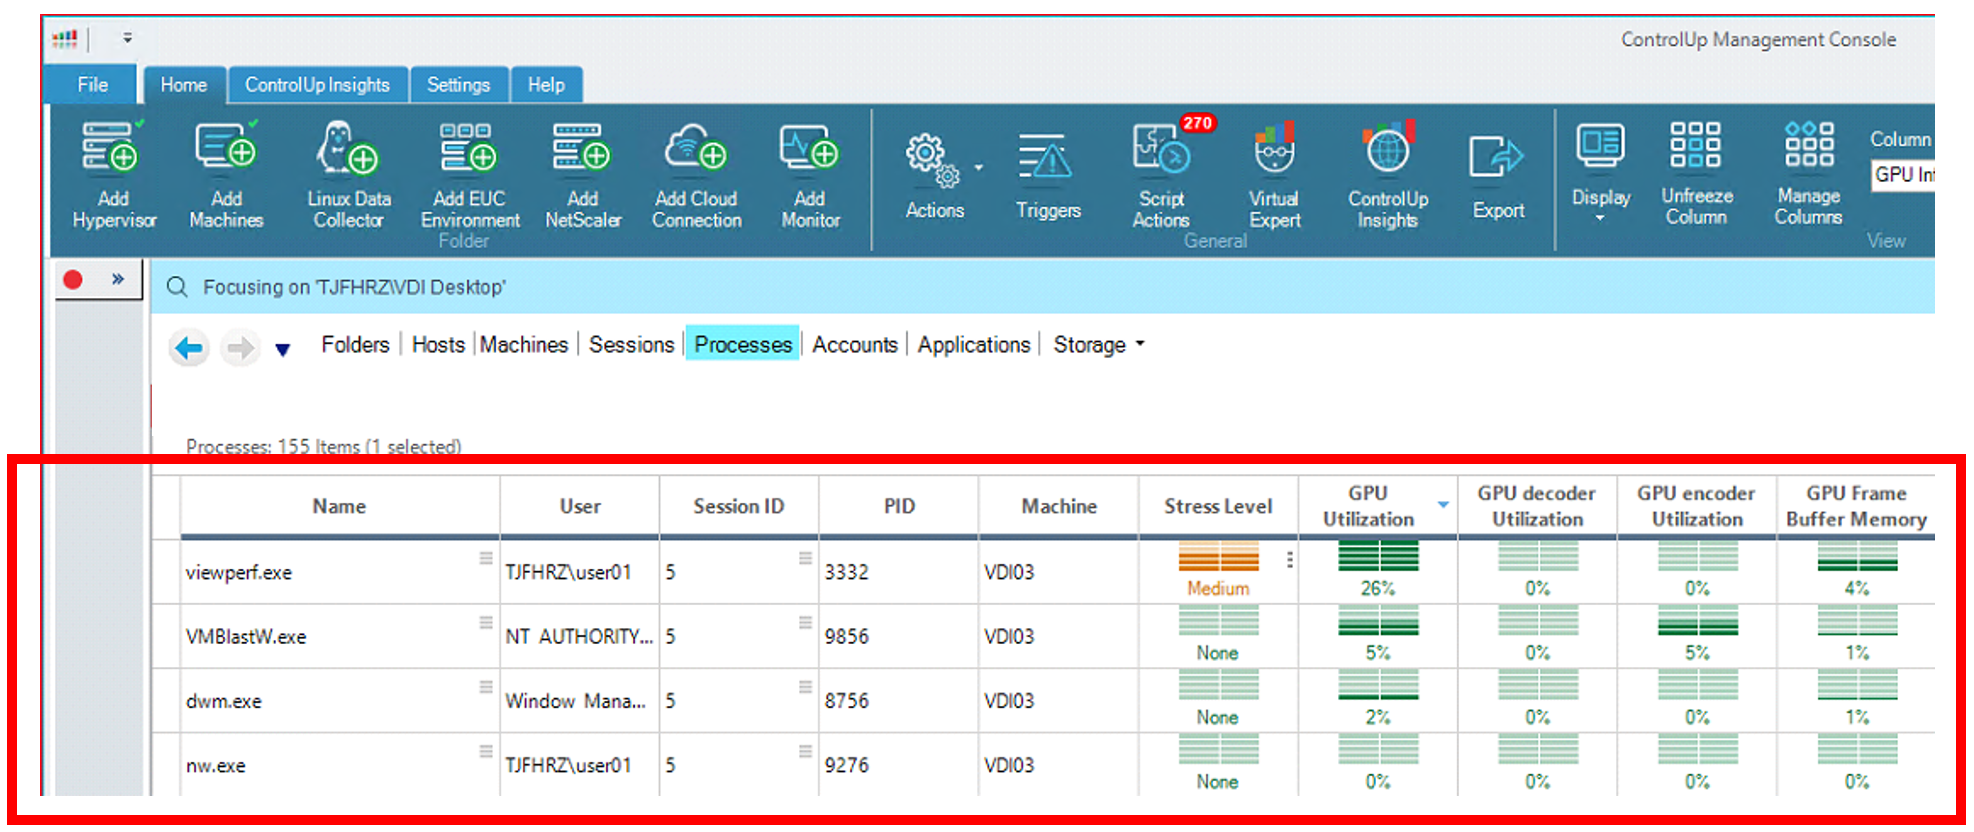
In the information grid in the screenshot below, for instance, you can see that viewperf, VMBlastW and dwm are using GPU resources and that the VMBlastW is using the GPU decoder. If you have multiple virtual desktops using GPU, then you will be able to monitor and sort all of the processes running on those virtual desktops.
Actions on GPU Processes
Just as with other processes, you can use the ControlUp Console to control GPU processes. This is useful if a user or process is over-consuming resources.
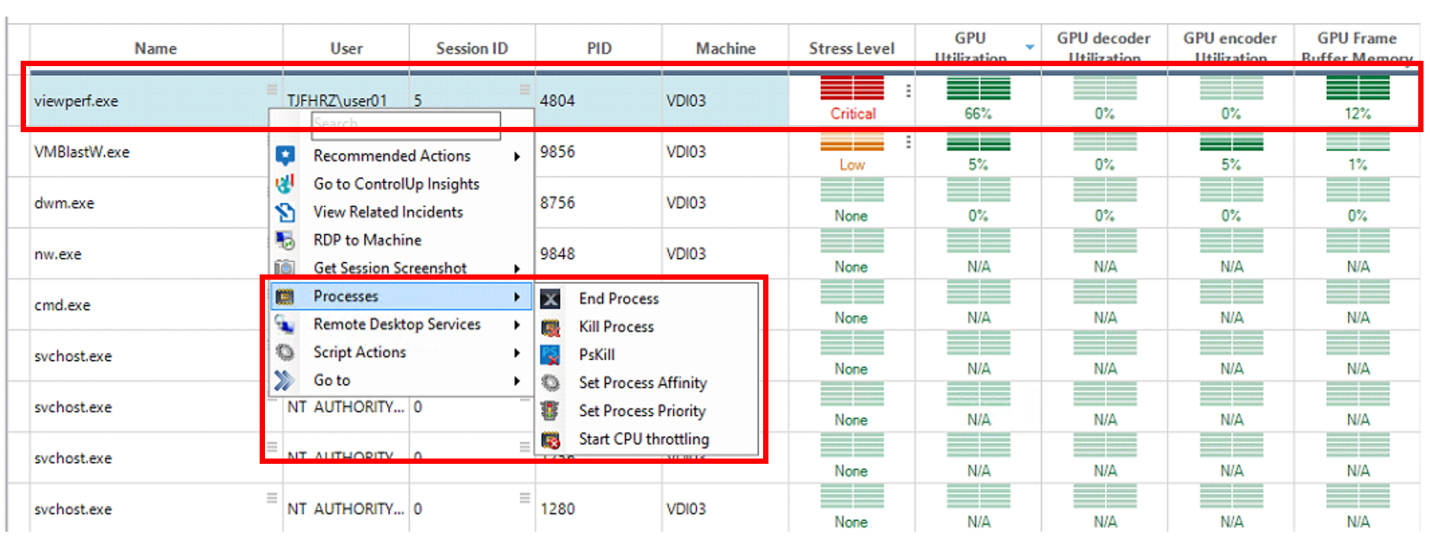
One of the interesting issues that we have seen in the past is that when the GPU frame buffer reaches 100%, the virtual desktop’s CPU usage will also start to rise. As such, you may want to monitor for this or create a trigger to automatically alert you when this happens.
‘Gotcha’ Issues
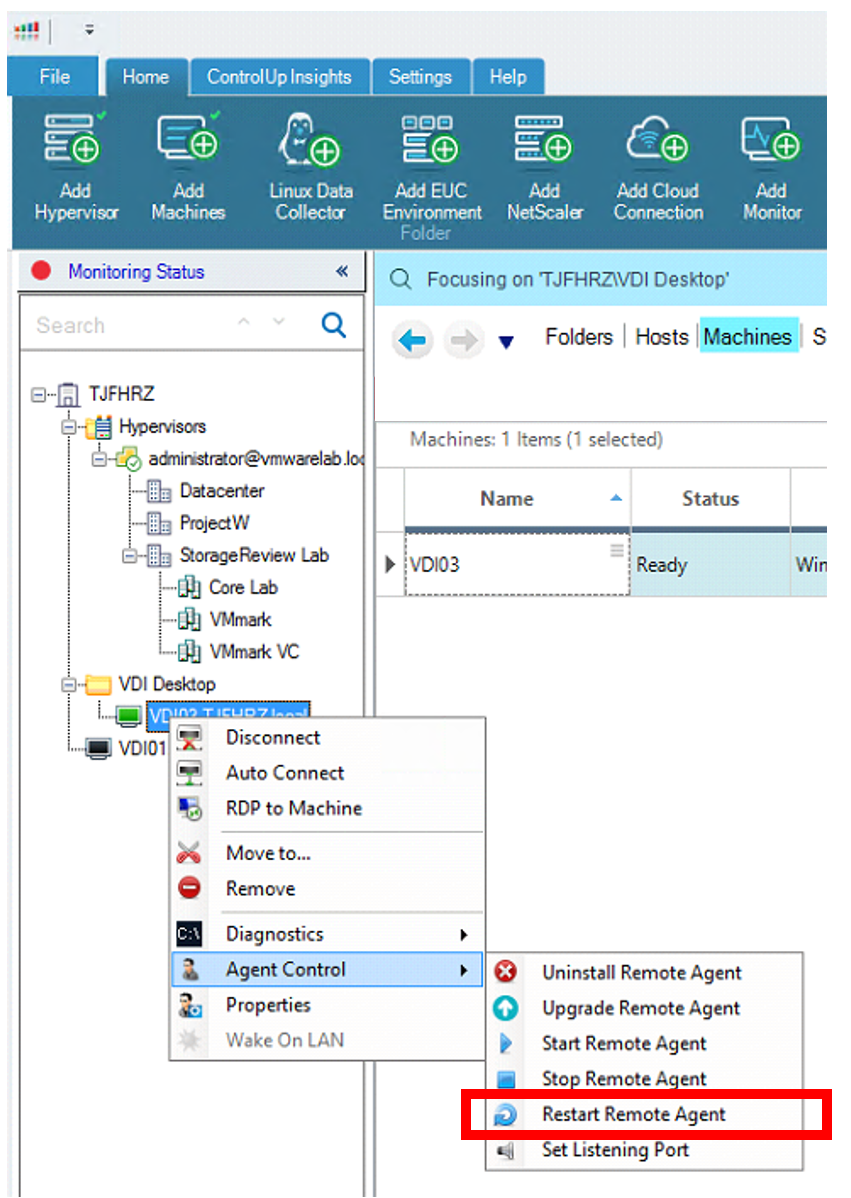
An issue I encountered when I first tried to monitor the ControlUp Console was that I didn’t initially see any information displayed about the GPU; I only saw the GPU activity.
As I discovered, this was due to not having the CUp agent running when I initially connected to the virtual desktop using the Horizon client. However, once I restarted the CUp agent, I was able to see the complete GPU information.
Another issue that I had when setting up the environment was that when I connected to my virtual desktop with a GPU attached to it from the vSphere client via the web or remote console, I got a black screen. After a little bit of investigation, I found that this was a well known issue and to be expected but I was able to work around it by connecting to the virtual desktop via an RDP connection or by using the Horizon client.
Conclusion
GPUs are an expensive resource, but their capability to be shared in a VDI environment can make them more cost efficient. As GPUs become more and more prevalent on virtual desktops, admins will need to continue to monitor organizational resources and processes to ensure that GPUs are being used effectively. ControlUp not only makes it easy to monitor them in real time – you can also create triggers to automatically alert you when they are not behaving correctly, and, if desired, a script action to perform self-healing on the affected components.