
Good news – vGPU adoption is skyrocketing. Bad news – vGPU environments aren’t being managed as well as they should. Until now…
The benefits of virtual GPU (vGPU) in a VDI environment are becoming clearer every day (here’s an example). It’s difficult to find a use case that’s not graphics-intensive. Medical image processing? Yes. Video-embedded applications? Sure. A web surfing browser? Of Course. A terminal window? Okay, you get the picture.
Users demand a better experience when using graphics-intensive applications. While it might be okay for a timecard form to load slightly slowly, it’s not acceptable for a video to jitter.
Between the options of throwing more CPU at the problem or taking the vGPU route, the answer is obvious. And that’s is why we’re seeing a rapid adoption of vGPU in VDI environments.
While vGPU provides a major boost to users’ experience, managing your vGPU resources remains tricky. Although vGPU vendors provide good monitoring options, they are focused on specific use cases, and it is impossible to get a “user-view” of exactly how much improvement vGPU has brought and see all your vGPUs troop real time usage. That’s where we step in.
With ControlUp 7.1 we have introduced vGPU metrics to the ControlUp console. Let’s take a look at what’s possible with these new additions:
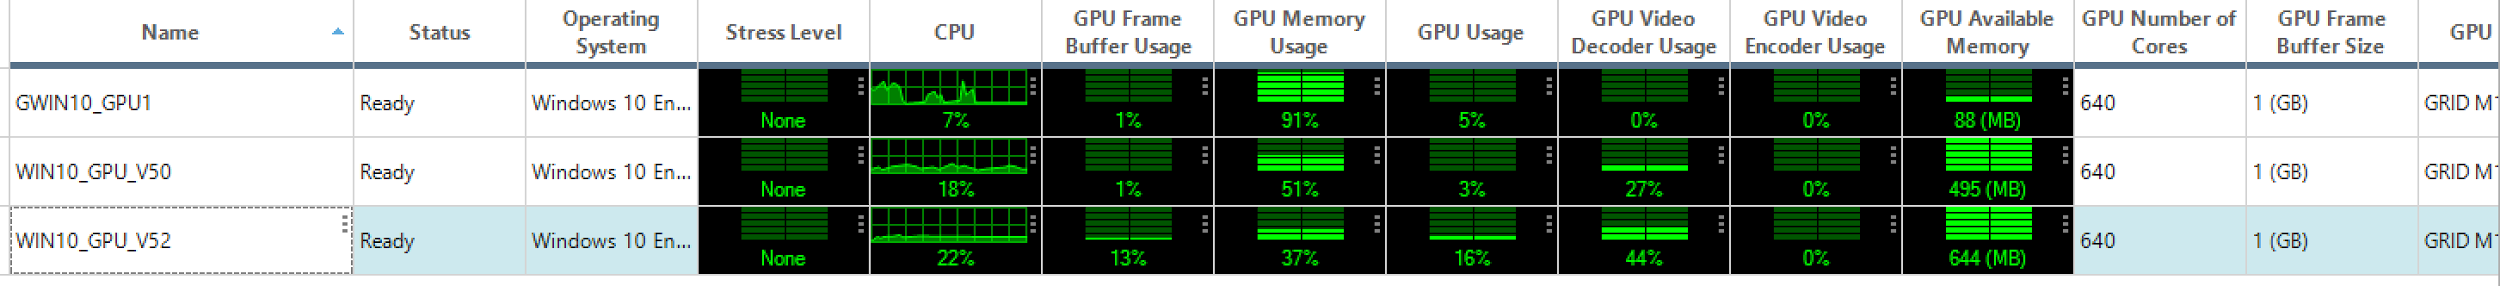
– Static VM level metrics like vGPU Model and architecture, number of cores and driver version
– Runtime VM level metrics like available memory, frame buffer size and amount allocated, video encoder and encoder usage.
– Runtime process level metrics show how many vGPU resources each relevant process consumes.
– Once historical and trending vGPU metrics will be added to ControlUp Insights (coming soon), you’ll be able to answer questions like: “which applications are the most vGPU intensive?” Or ”At our current growth rate how long until we need to add more resources?”
Let’s see what it actually looks like, starting with VM level vGPU metrics:
As always with ControlUp you can drill down to see these vGPU metrics for the processes inside a VM. Double clicking on ‘WIN1_GPU_V52, drills down to process level view –
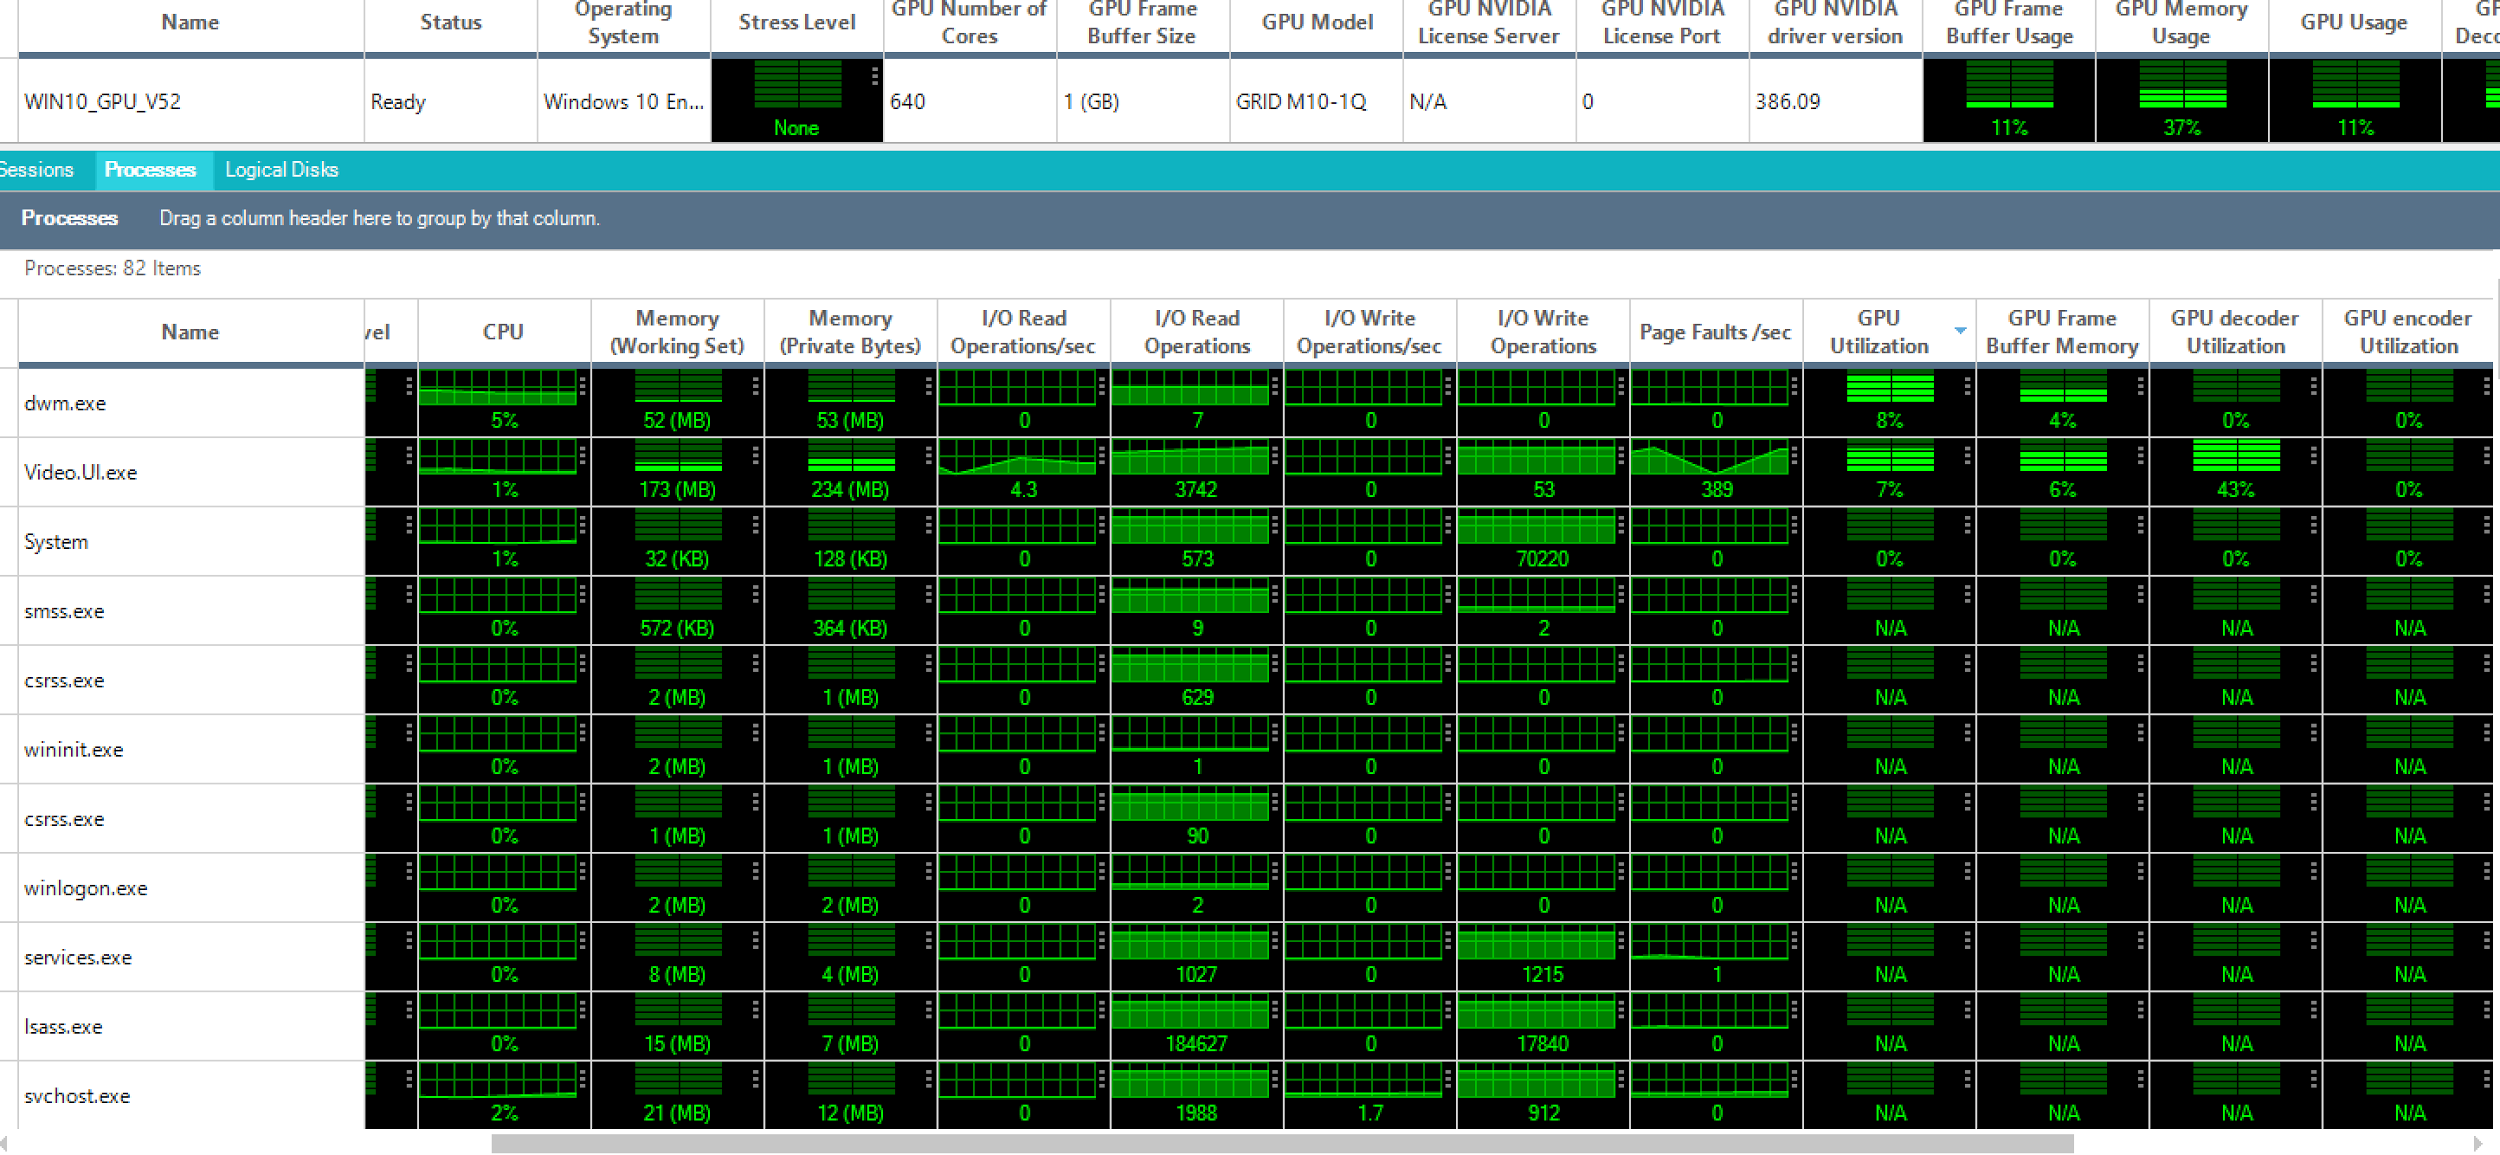
Through our agent you get an in-guest view into vGPU resource usage and consumption, such as what percentage of GPU was used by this virtual OS? Which process within this user’s OS consumed how much processing and memory? And of course who are the users that consumes a bigger portion of the vGPUs.
I invite you to download our 7.1 beta and check this out for yourself in your vGPU environment!