
With the release of ControlUp for VDI v8.6.5, three new CMDLETs have been added to the ControlUp PowerShell user module. These new CMDLETs are Invoke-CUQuery, Export-CUQuery, and Get-CUVendorVMs.
Whether you’re an IT administrator, a help desk engineer, or a CIO, getting relevant data as quickly and efficiently as possible is critical to the success of your business. In the good old days, IT administrators would gather data from a graphical user interface (GUI), copy it to an Excel spreadsheet, and format it in pretty Pivot tables. Since then, the world has changed dramatically and we need more efficient methods of data gathering in order to be productive in our day-to-day jobs.
Today, obtaining information as fast as possible requires accessing software components programmatically, either through an API or using vendor-based commands.
Data Access from the ControlUp Monitor
ControlUp Monitor (a.k.a “the monitor”) plays a key role in monitoring your data sources, such as virtual machines, hypervisor connections, or virtual desktop infrastructures. The monitor further interacts as an authentication gateway for Solve and Insights, our web-based graphical interface that represents real-time and historical data. The monitor then collects metadata from your virtual infrastructure or data, like health statistics, usage metrics, and events, from the monitors themselves.
Before ControlUp for VDI v8.6.5, the monitor was a closed ecosystem with no API access to the data it gathered. You needed a graphical user interface—such as the Real-Time Console or Solve—to retrieve data from monitored resources. We have now simplified the process of retrieving data programmatically and introduced new CMDLETs in v8.6.5 that enable you to retrieve this rich data directly from the monitors.
The New CMDLETs
With the release of ControlUp for VDI version 8.6.5, three new cmdlets have been added to ControlUp.PowerShell.User module. These CMDLETs are Invoke-CUQuery, Export-CUQuery, and Get-CUVendorVMs. You can read more about how to use the Invoke-CUQuery cmdlet in the documentation. Our knowledge base has detailed information about and instructions for the different Monitor Cluster PowerShell cmdlets. You can also watch the new PowerShell CMDLETs in action with InfluxDB in this demo video:
Support, we have a problem!
Nothing can ruin your good mood on a sunny day, right? Nothing, except when you receive a phone call from your CIO, informing you that no historical data is available for a virtual machine that is critical to the success of the enterprise. Your first thought is, “Oh, [EXPLETIVE]!” How did you miss this data gap? Why didn’t you receive alerts about this?
ControlUp can help with this issue in many ways! Let’s say, as in this case with your CIO, you haven’t received any alerts. You can verify the data gap from the Insights report, as shown in the screenshot below, and immediately identify the monitors that have not sent data for two days.

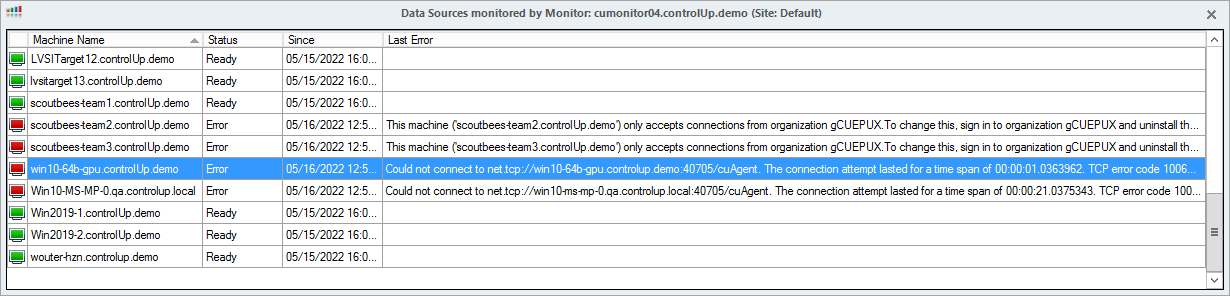
Most likely, there is a problem with the connection between the ControlUp Agent on the VM and the monitor. Identifying the monitor assigned to this VM is the first step in troubleshooting the problem. In a large environment, it might take some time to find this monitor. Fortunately, ControlUp makes it simple to identify and remediate the problem. In this case, our environment contains only four monitors and you can find the monitor by clicking on the list of data sources (see screenshot below):

Clicking on each data source and sorting by Machine Name reveals the problem with the machine. You can learn more about this error by viewing the Last Error column. In this case, you see a connection error with the agent. As shown in the screenshot below, the monitor is not able to connect to the agent running on win10-64b-cpu.controlUp.demo:
That’s great! You’ve found the problem and can easily fix it. But wait! How much time did it take to actually see what’s going on here?
Opening the Console took roughly one minute and identifying the monitor connected to this VM took about one minute. In the best case, it only took us two minutes to see the error, and this was just for one machine! Imagine if you had to do the same for several virtual machines.
Here is the point: Take advantage of more efficient ways to retrieve relevant information! Are the new Monitor Cluster CMDLETs going to be helpful in this situation? Absolutely, and we’ll show you how.
Use ControlUp’s PowerShell CMDLETs to troubleshoot in just seconds
Rather than opening the console or clicking through multiple windows and pop-ups, you can (and should) use the new PowerShell CMDLETs. Here’s how you do this with PowerShell:
- Remote connect to any monitor machine with an AD account that is known in ControlUp.
- Open a PowerShell session and run the following command:
$pathtomodule = (Get-ChildItem "C:\Program Files\Smart-X\ControlUpMonitor\*ControlUp.PowerShell.User.dll" -Recurse | Sort-Object LastWriteTime -Descending)[0]
Import-Module $pathtomodule
- Copy and paste the command into a PowerShell session.
(Invoke-CUQuery -Table "Computers" -Fields *).data `
| Select-Object FQDN, ConnectionError | Where-Object {$_.FQDN -eq 'win10-64b-gpu.controlup.demo'}You can see that we filter the FQDN of the machine in the Where-Object block. In less than a second, the ConnectionError of the machine is shown in the output.
You can see that we filter the FQDN of the machine in the Where-Object block. In less than a second, the ConnectionError of the machine is shown in the output.

As you can see, the CMDLET is intuitive and user-friendly. Once you work more with them, you will need to reuse the code snippets.
💡 PRO TIP: Save the code snippet(s) to your local machine, then copy and paste them as needed into a PowerShell session.
Writing a reusable function
If you are an advanced PowerShell user, you can write your own functions to make your script more interactive. Functions dramatically increase usability and make PowerShell much easier to work with. Instead of rewriting code over and over again, you can focus on building reusable functions. Before you sit down and start coding, take a few minutes to think about design and ask yourself if a function is the best way to achieve your goal. Functions should serve one primary purpose, and that is to perform a single action.
For this example, we are using a common use case: Querying all machines for a specific VM Power State. Let’s focus on two possible states: “ON” and “OFF”. As a side note, there are other power states, depending on the type of infrastructure (i.e., CVAD, vSphere, or VMware Horizon). Let’s keep things simple by filtering machines that are either turned on or off.
function Get-MachinesWithPowerState {
    [CmdletBinding()]
    param (
        [Parameter(Mandatory = $true)]
        [ValidateSet('On', 'Off')]
        [string[]]$PowerState
    )

    (Invoke-CUQuery -Scheme Main -Table Computers -Fields * -Where "vmPowerState LIKE '$($PowerState)'").Data | `
        Select-Object @{Name = 'Machine Name'; Expression = 'sName' }, @{Name = 'Power State'; Expression = 'vmPowerState' }

}
Run the following command to see a list of all the machines that are on:
Get-MachinesWithPowerState -PowerState On
The result will look like this:
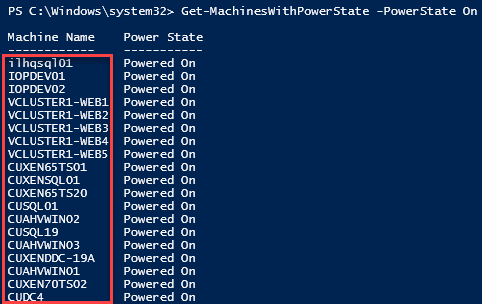
You can see how the cmdlets make it easy for you to find information and create custom scripts to retrieve information within seconds. In this article, we demonstrated how you can use the Invoke-CUQuery CMDLET simply and efficiently.
Check out the following links to read more in-depth about certain topics related to this blog:
- Monitor Cluster Cmdlets – Overview
- Invoke-CUQuery
- Invoke-CUQuery – Examples
- Export-CUQuery
- Export-CUQuery – Examples
- Cmdlet Reference Tables
- Cmdlet Fields-by-Table Reference
Also, we just announced the release of Real-Time DX v8.6.5, which, in addition to these new PowerShell CMDLETs, includes script and trigger enhancements, new PVS metrics, new third party integrations, and more!
Want to see this all in action? Register for our deep-dive webinar on Wednesday, June 8, where you’ll get the low-down on all of the updates to Real-Time DX, plus a live look at all of these features at work. Join us!