This post explains that "VDI monitoring tools" vary significantly in scope and functionality. It categorizes them into five distinct types and asserts that the most effective solutions provide comprehensive, cross-platform visibility coupled with autonomous, AI-driven problem resolution within the guardrails IT sets.
- VDI monitoring tools include native platform utilities, general infrastructure/observability platforms, vendor-agnostic cross-platform solutions, unified AVD/cloud VDI management platforms, and RMM/UEM-bundled monitoring.
- The critical differentiator among these tools is their ability to move beyond mere issue identification to automatically diagnose and fix problems across diverse VDI environments.
- For complex and hybrid VDI setups, proactive, AI-driven monitoring and management solutions that consolidate visibility and automate resolutions are presented as optimal.
A team member’s virtual desktop session starts lagging. Within moments, the blame game is in full swing. The network team blames the app team. The app team blames the user’s home Wi-Fi. IT is stuck in the middle. They have to investigate every possibility. Minutes turn to hours while frustration builds.
Sound familiar?
When a virtual desktop infrastructure (VDI) slows down, there are a range of potential culprits: the network, the servers hosting the desktops, storage, and the employee’s device. Any one of these, or a combination of multiple, could be the cause of VDI performance issues. But with the right tool, pinpointing and fixing problems can be fast and easy, and automation can handle the heavy lifting for you.
When we say ‘VDI’ here, that includes both traditional on-prem VDI and cloud-hosted DaaS platforms, so the categories below apply to both. This article explains the different types of monitoring tools on the market, with real customer data on what each one delivers, so you can figure out which solution actually solves your VDI issues.
Why “VDI Monitoring Tool” Means Different Things to Different Vendors
The search term “VDI monitoring tools” encompasses products that each perform different tasks. While all of them aim to provide the visibility needed to improve VDI performance, they each approach it differently.
For instance, Citrix monitoring tools focus narrowly on the Citrix stack itself, digging into session and protocol performance within a single vendor’s ecosystem. On the other hand, general-purpose IT monitoring tools take a broader view. They track VDI alongside the rest of the infrastructure, but they may lack the protocol-level depth needed to pinpoint session-specific issues.
To use an analogy, suppose you’re looking for a “car maintenance tool.” That could be a tire gauge or a full diagnostic scanner. It could even refer to a comprehensive set of tools a mechanic uses to assess vehicle performance. Technically, all of the above are “car maintenance tools.” But they all solve very different problems.
It’s the same with VDI monitoring. Each tool focuses on a different piece of the puzzle, and some look at a completely different puzzle altogether.
The Five Categories of VDI Monitoring Tools
There are five types of VDI monitoring tools, each with its own niche purpose.
1. Native Platform Tools
As the name suggests, native platform tools come with the VDI platform itself. Some common options include Citrix Director/Analytics, Azure Monitor + Log Analytics for Azure Virtual Desktop (AVD), and Omnissa’s Aria Operations integration for Horizon.
Being native tools, they ship with the platform itself, often at no added cost, and surface platform-specific telemetry. That’s genuinely valuable, but it’s built to answer a different question—if the vendor’s own infrastructure is healthy—not to measure employee experience on a given session. Azure Monitor + Log Analytics, for example, is excellent for infrastructure-level reporting, but it isn’t built to track real-time metrics like logon duration, and its consumption-based pricing can make cost forecasting tricky. That’s not a knock on any specific platform; it’s true of native tools across the board.
These tools are strong at confirming the platform itself is running and at after-the-fact reporting, similar to the dashboard gauges in a car. At the same time, like a car’s gauges, they only give you info about that one car. So if you have more than one VDI platform, you’re constantly bouncing from one dashboard to the next. An organization running Citrix and AVD side by side ends up with two consoles that don’t communicate.
→ Real-World Impact: Native tools provide excellent baseline metrics within their specific ecosystems. However, when organizations run multi-vendor environments or execute migrations, managing separate consoles introduces visibility boundaries. During a major cloud migration, a large Scandinavian healthcare region that operates over 13,000 daily VDI sessions struggled to manage session performance throughout hardware updates. By pairing their environment with vendor-agnostic optimization telemetry, they identified configuration bottlenecks, reduced VDI logon times by 22 seconds per session, and reclaimed over 80 hours of clinical staff productivity every single day, all while optimizing backend host density to reduce hardware costs.
2. General Infrastructure/Observability Platforms
General observability platforms are broader monitoring tools that can ingest data from specific VDI infrastructure. They provide important yet general information that may lack the specificity IT teams need.
General infrastructure and observability VDI monitoring software is similar to a whole-house security system. It can tell you the power’s down, but it can’t assess the quality of the living room Wi-Fi.
While general platforms are good for high-level VDI troubleshooting, they may fall short in providing user- or session-specific data. They can tell if your infrastructure is healthy, but not how each user’s session performs.
→ Real-World Impact: Broad observability tools are effective for general server monitoring, but they often lack deep visibility into user-specific session protocols (such as ICA/HDX or RDP) and last-mile connectivity. A global investment management firm attempted to troubleshoot recurring application crashes and performance issues using general infrastructure monitoring tools. Because broad tools couldn’t pinpoint session-level bottlenecks or last-mile degradation, support teams remained locked in manual troubleshooting cycles. By adopting VDI-aware DEX telemetry, the organization gained deep process-level visibility, streamlined L1 support workflows, and significantly reduced Mean Time to Resolution (MTTR).
3. Vendor-Agnostic, Cross-Platform VDI/DEX Monitoring
Vendor-agnostic, cross-platform VDI and Digital Employee Experience (DEX) monitoring tools sit in a crucial sweet spot. They can watch multiple platforms simultaneously. For example, with ControlUp for VDI, you can monitor Citrix, Horizon, and AVD from a single console.
Cross-platform observability paves the way to standardize your monitoring solution across your entire VDI estate, rather than juggling multiple native consoles.
In some ways, it’s like having a universal remote for an entire entertainment system. Instead of going back and forth between different remotes for each device, you have all the control you need in one hand. So you can have a single VDI management software to handle all VDI troubleshooting across vendors. Citrix, Horizon, and AVD monitoring can all happen under the same roof, making this the best VDI performance monitoring and optimization solution for many organizations.
There is a one-time trade-off, however. Standing up a new tool takes an initial integration effort. What you get in exchange is fewer tools, not more, with one console replacing the native dashboards you’d otherwise be switching between. For teams juggling multiple VDI platforms, that swap (especially when it deploys in mere days) pays for itself fast.
→ Real-World Impact: When a large national financial institution migrated thousands of users from legacy on-prem VDI to AVD, operating separate native consoles created major visibility gaps and prolonged logon delays. By deploying vendor-agnostic DEX telemetry, their IT operations team established unified metrics across both platforms in a single view. This single pane of glass eliminated cross-team finger-pointing, streamlined root-cause analysis, and accelerated their cloud migration schedule without sacrificing user experience.
ControlUp for VDI is also part of ControlUp ONE, a fully unified platform with an agentic AI engine at its core. AI can act on an issue, not just flag it, within the guardrails IT sets. That’s the difference between a console that shows you every VDI platform in one place and one that also fixes what it finds across all of them.
4. Unified AVD/Cloud VDI Management Platforms
Unlike the cross-vendor tools in Category 3, unified AVD/cloud VDI management platforms are built around a single environment. They focus on AVD provisioning, autoscaling, and cost management, and monitoring comes bundled in, often surfacing capabilities such as automated root cause analysis for VDI login issues, rather than being the primary job. So while they can help you spot and diagnose issues like login delays, that’s a byproduct of their core purpose, not what they’re built to do.
You can think of unified AVD/cloud VDI management platforms as property management companies. Yes, they water your plants, but that’s just a single item on a long list of other tasks.
If you need proactive AVD session host monitoring and repair, for instance, these can be good solutions. But the trade-off is that you may have to sacrifice monitoring depth.
→ Real-World Impact: While cloud desktop management platforms handle workspace provisioning and autoscaling, remote user performance often depends on variables outside the cloud host (such as home Wi-Fi quality and ISP latency). A major U.S. financial services firm running over 6,000 cloud VDI sessions for distributed contact center agents struggled to diagnose intermittent call degradation. By pairing their cloud deployment with end-to-end endpoint and network telemetry, support teams gained full visibility into local Wi-Fi signal strength and home network drops, allowing them to resolve agent performance issues instantly and eliminate cross-team friction.
5. RMM/UEM-Bundled Monitoring
Remote monitoring and management and unified endpoint management (RMM/UEM) add monitoring to a broader endpoint and device management suite. An RMM/UEM platform may manage phones, laptops, and company-wide patching, while incorporating monitoring in there as well.
It’s similar to a car that comes with keyless entry as one of its many features. That’s convenient, but you didn’t buy the car for keyless entry. You bought it to drive.
If you already use an RMM/UEM solution for device management, it can help with monitoring. But it may not provide the deep, VDI-specific details needed to optimize your system’s performance. Also, you may not get detailed session host health info or protocol-level data, such as ICA/PCoIP latency.
What to Ask When Comparing Tools
Looking at each tool type can make it hard to focus on what you really need. The real question isn’t “Which category is best for us?” It’s “What should this tool actually let you do?”
Once you know what a tool monitors, determine whether it only reports issues or also remediates them automatically.
Once you know what a tool monitors, determine whether it only reports issues or also drives Autonomous Endpoint Management (AEM), using AI to fix common problems.
Where ControlUp Fits
ControlUp for VDI fits into category 3: purpose-built, cross-platform monitoring. It does way more than just watch your virtual desktop environment. Using AI for proactive VDI performance monitoring, ControlUp resolves issues automatically while always adhering to IT-defined policies, so your team can refocus on strategic, value-adding work.
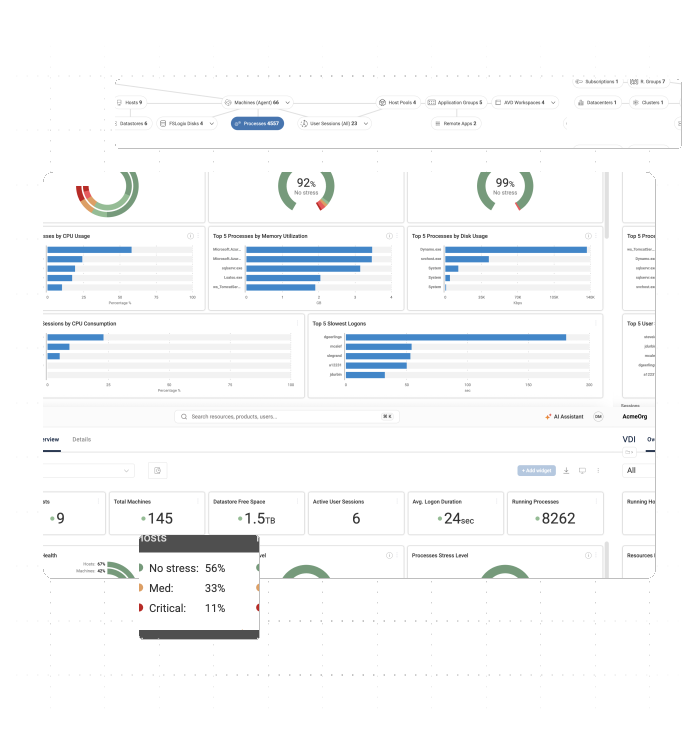
If those earlier examples felt familiar, that’s because each one reflects a real team that closed the gap with ControlUp.
→ Real-World Impact: Surfacing an error code is only half the battle; real efficiency comes from resolving issues automatically before users log a ticket. A tier-1 telecommunications provider supporting tens of thousands of endpoint devices implemented policy-driven automated remediations for routine issues like memory leaks, profile container locks, and CPU priority adjustments.
By allowing automated triggers to remediate recurring system bottlenecks behind the scenes, the team executed over 4.9 million automated remediations in under three months with ControlUp. They drastically reduced helpdesk ticket queues and reclaimed thousands of engineering hours that had previously been lost to manual firefighting.
Get the VDI Monitoring Tool That Best Supports Your Team’s Work
If you’re looking for how to manage on-premises and cloud VDI together, the “best” solution depends on what you’re trying to see and do. There’s no universal cure-all. You just need the right solution for your environment. For many organizations, proactive, AI-driven VDI performance monitoring checks all of the necessary boxes.
Book a demo and start solving your biggest VDI challenges.
