Explore ControlUp’s Interactive Demos
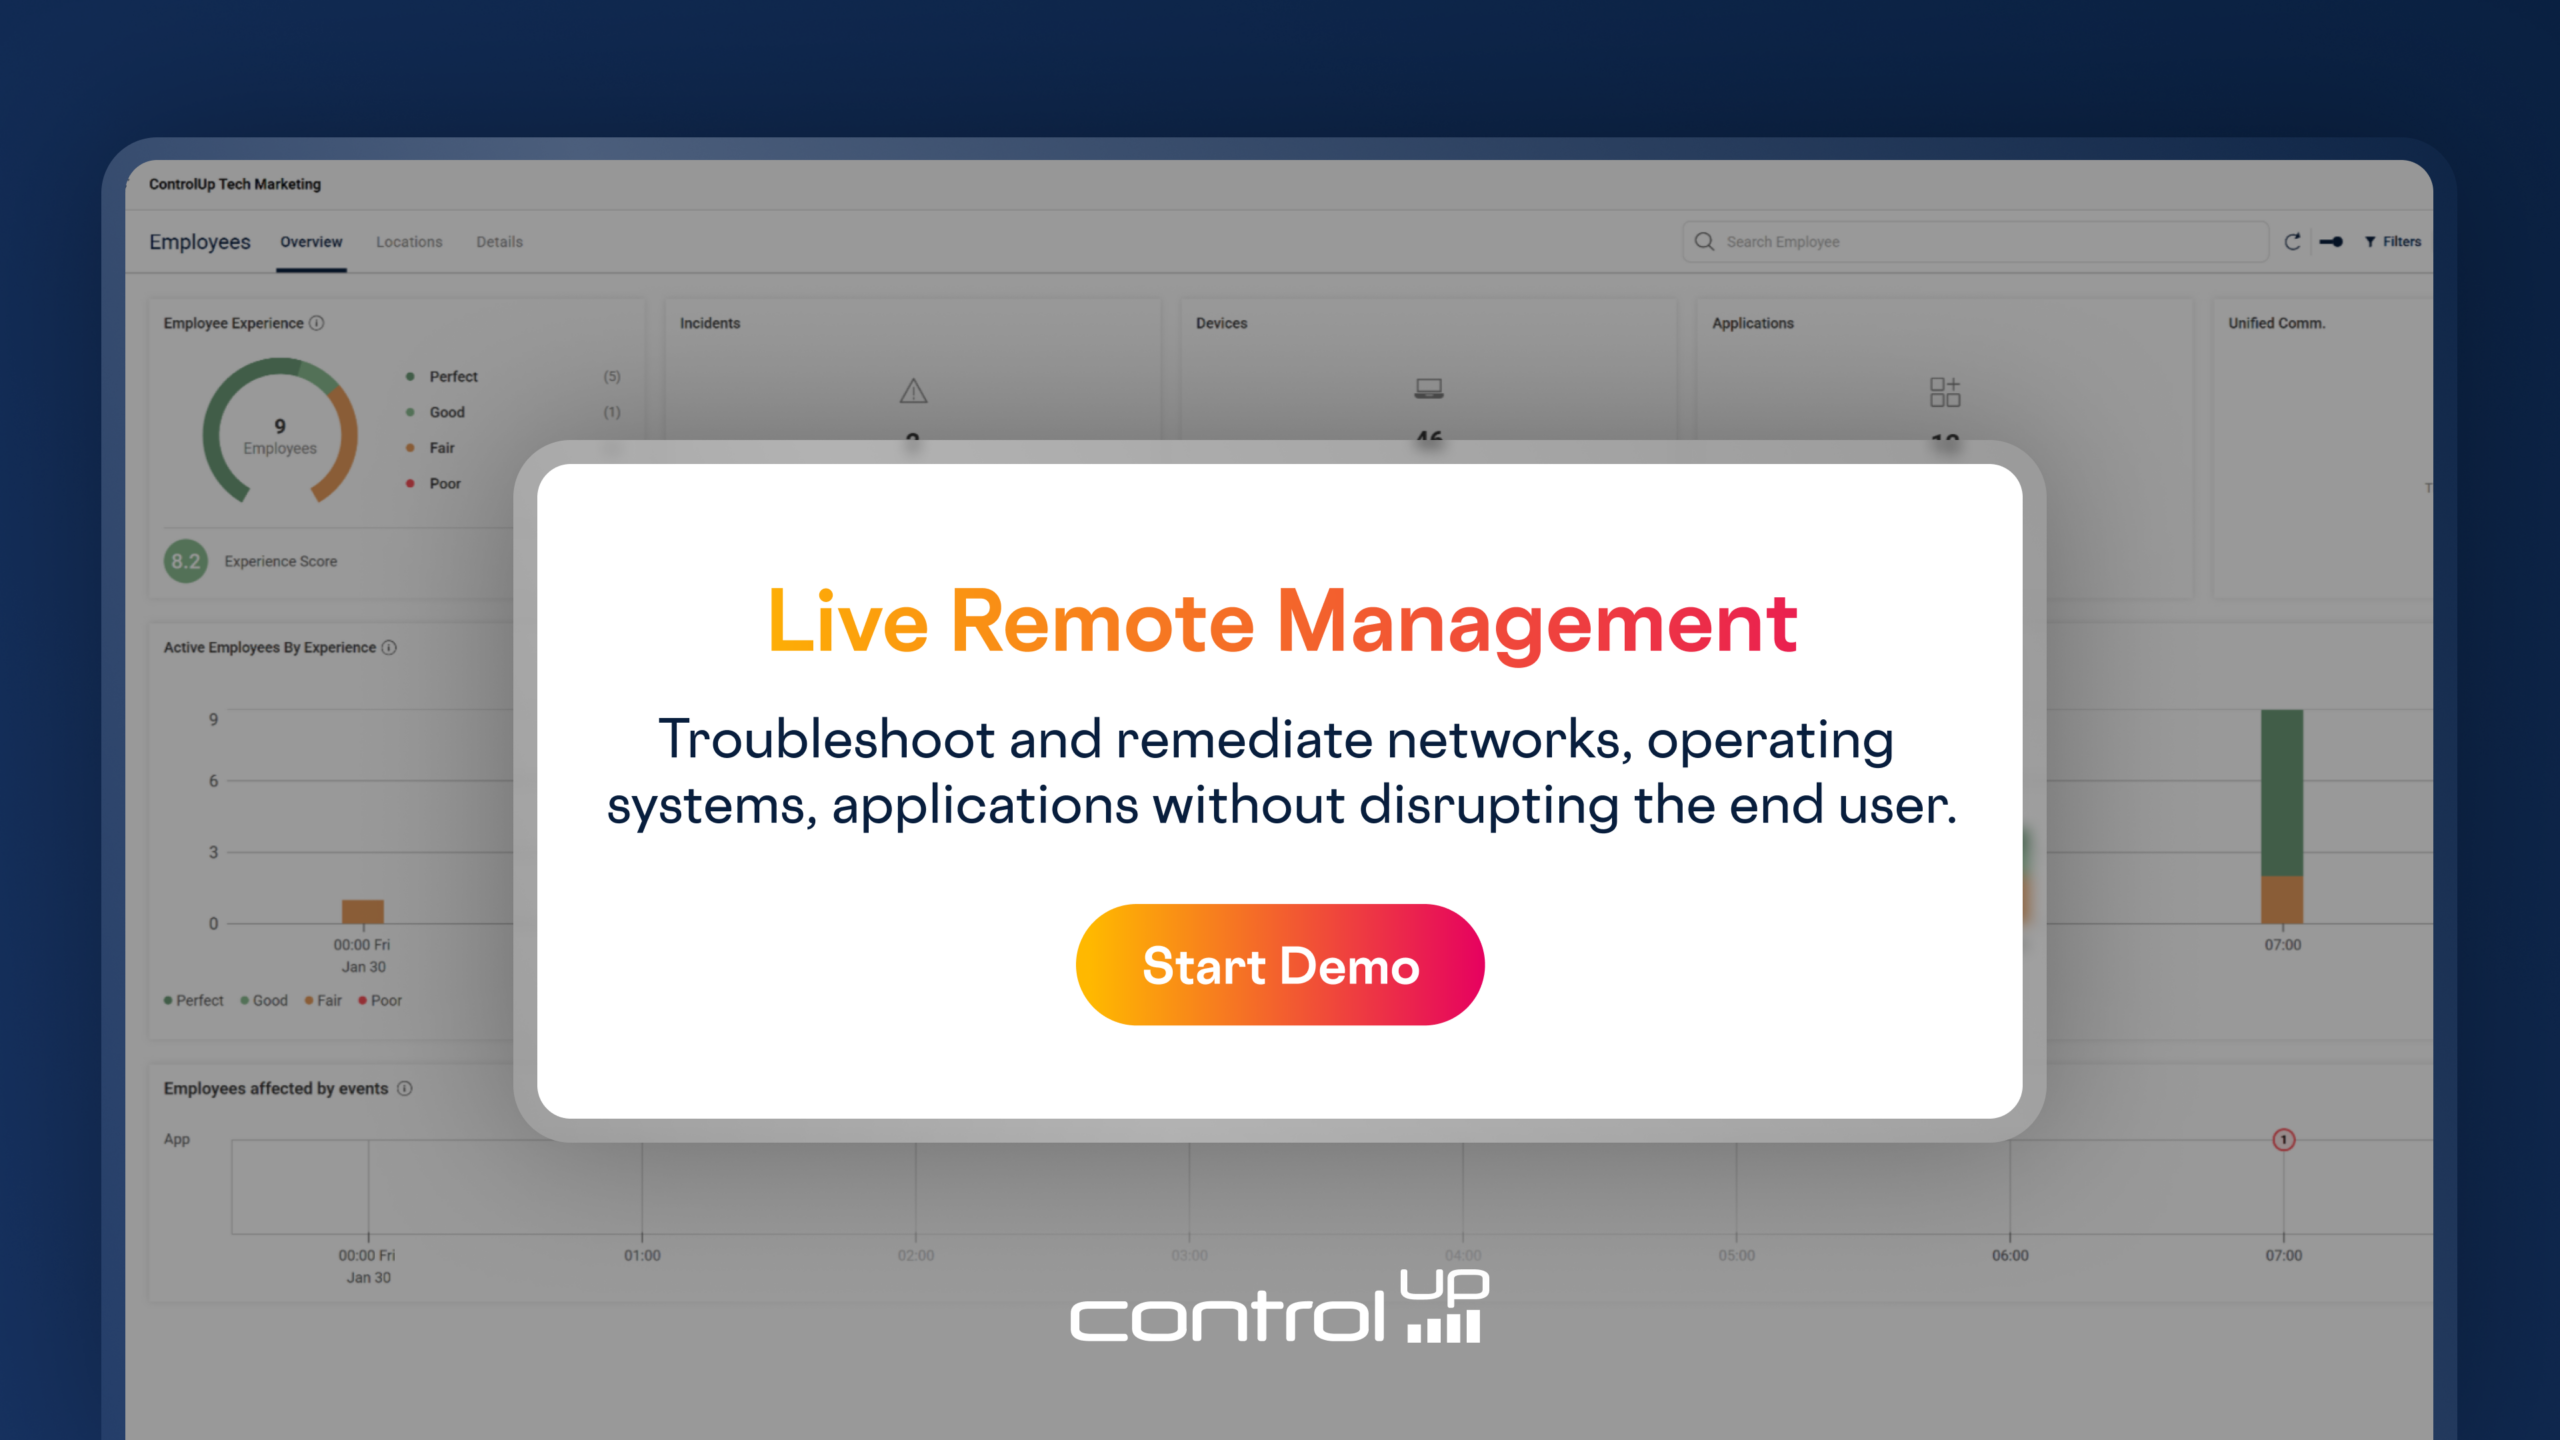
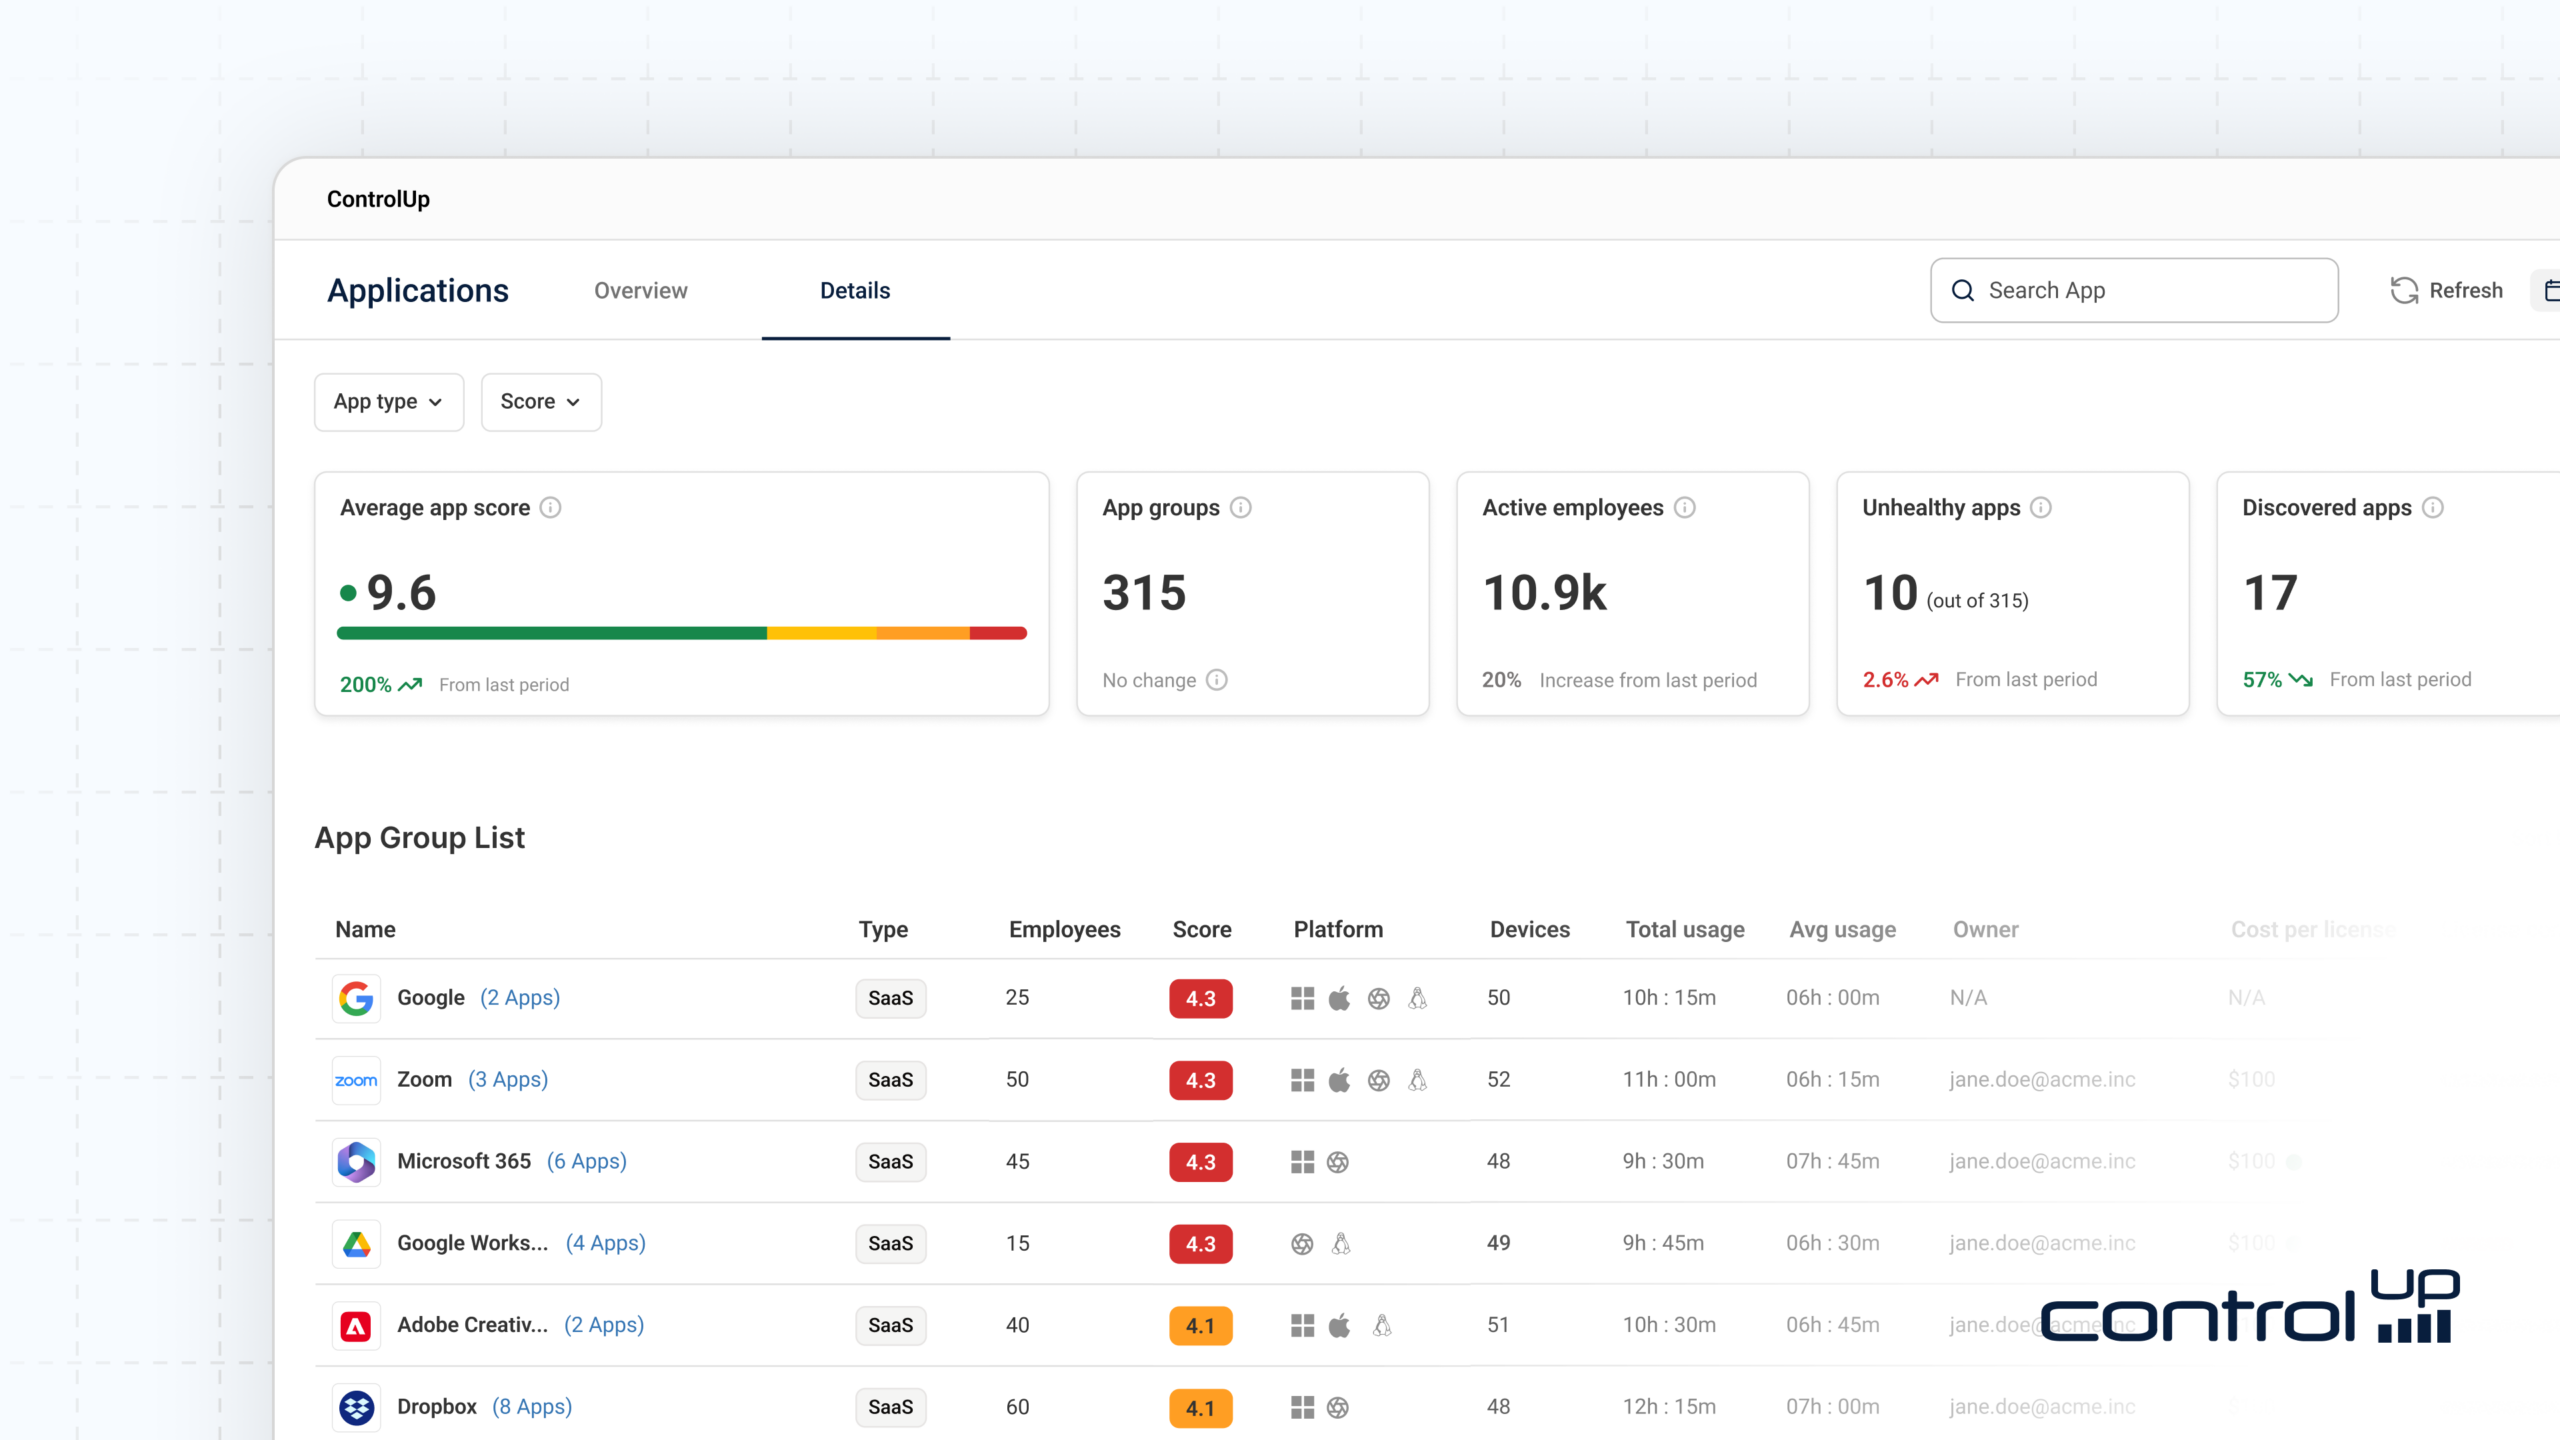
If you’re evaluating ControlUp and want to see the platform in action before scheduling a call or starting a trial, you’re in luck. ControlUp publishes a growing library of interactive, self-guided demos with no login required, no sales rep needed....
July 22, 2026


Subscribe to Our Blog
Stay up to date with our latest resources and articles.
