

ControlUp's Pulse AI Insights addresses the challenge of data overload in IT monitoring by proactively analyzing telemetry to surface critical operational findings, enabling IT teams to shift from reactive troubleshooting to confident, proactive action.
Pulse Insights continuously processes ControlUp data, prioritizing alerts with severity rankings, environmental correlations, AI-generated summaries, and recommended next steps to reduce investigation time.
It supports key use cases such as App Crash, BSOD, and Application Resource Consumption, delivering actionable intelligence without requiring manual investigation.
The system aims to significantly reduce alert fatigue, decrease Mean Time To Resolve (MTTR), and empower IT leaders to focus on strategic work by highlighting only what genuinely deserves attention.
Pulse AI is the intelligence layer behind the ControlUp ONE platform, correlating signals across endpoints, applications, and infrastructure to help IT teams move from reactive troubleshooting to proactive, confident action.
Pulse AI is built around three core capabilities: Pulse AI Resolve, brings self-service and automated resolution to the endpoint; Pulse AI Assistant, which provides contextual, natural-language guidance across the platform; and Pulse AI Insights, which analyzes environment data continuously to surface the findings that matter most.
This post is about Pulse Insights, and why it earns its place among the three.
IT leaders do not lack data. Every device, application, and interaction generates telemetry: the challenge is turning that flood of information into decisions.
Most monitoring tools leave teams to do the analysis themselves: sift through events, connect changes, and decide what truly needs attention. That manual work is costly and becomes harder to sustain as environments grow.
Pulse Insights is built to close that gap, analyzing environment data continuously and surfacing the findings that matter, so IT leaders get clarity without adding headcount.
What Is Pulse Insights?
Pulse Insights tells you what matters, so you do not have to search for it.
By proactively analyzing ControlUp data, Pulse Insights identifies meaningful findings, patterns, and opportunities that need attention. It builds on the events and telemetry ControlUp already collects, highlighting what matters most so leaders do not have to search for it.
For IT leadership, that shift matters: less time spent by the team investigating and triaging, more time spent acting on what is confirmed to be important.
It is important to define the scope: Pulse Insights is not real-time monitoring, and it does not replace events. Today it covers five use cases, with more being added as the product matures to broaden monitoring coverage. Some environments may have nothing to report, and not every insight indicates an operational issue. An empty feed may simply mean nothing met the threshold for attention, which is by design.
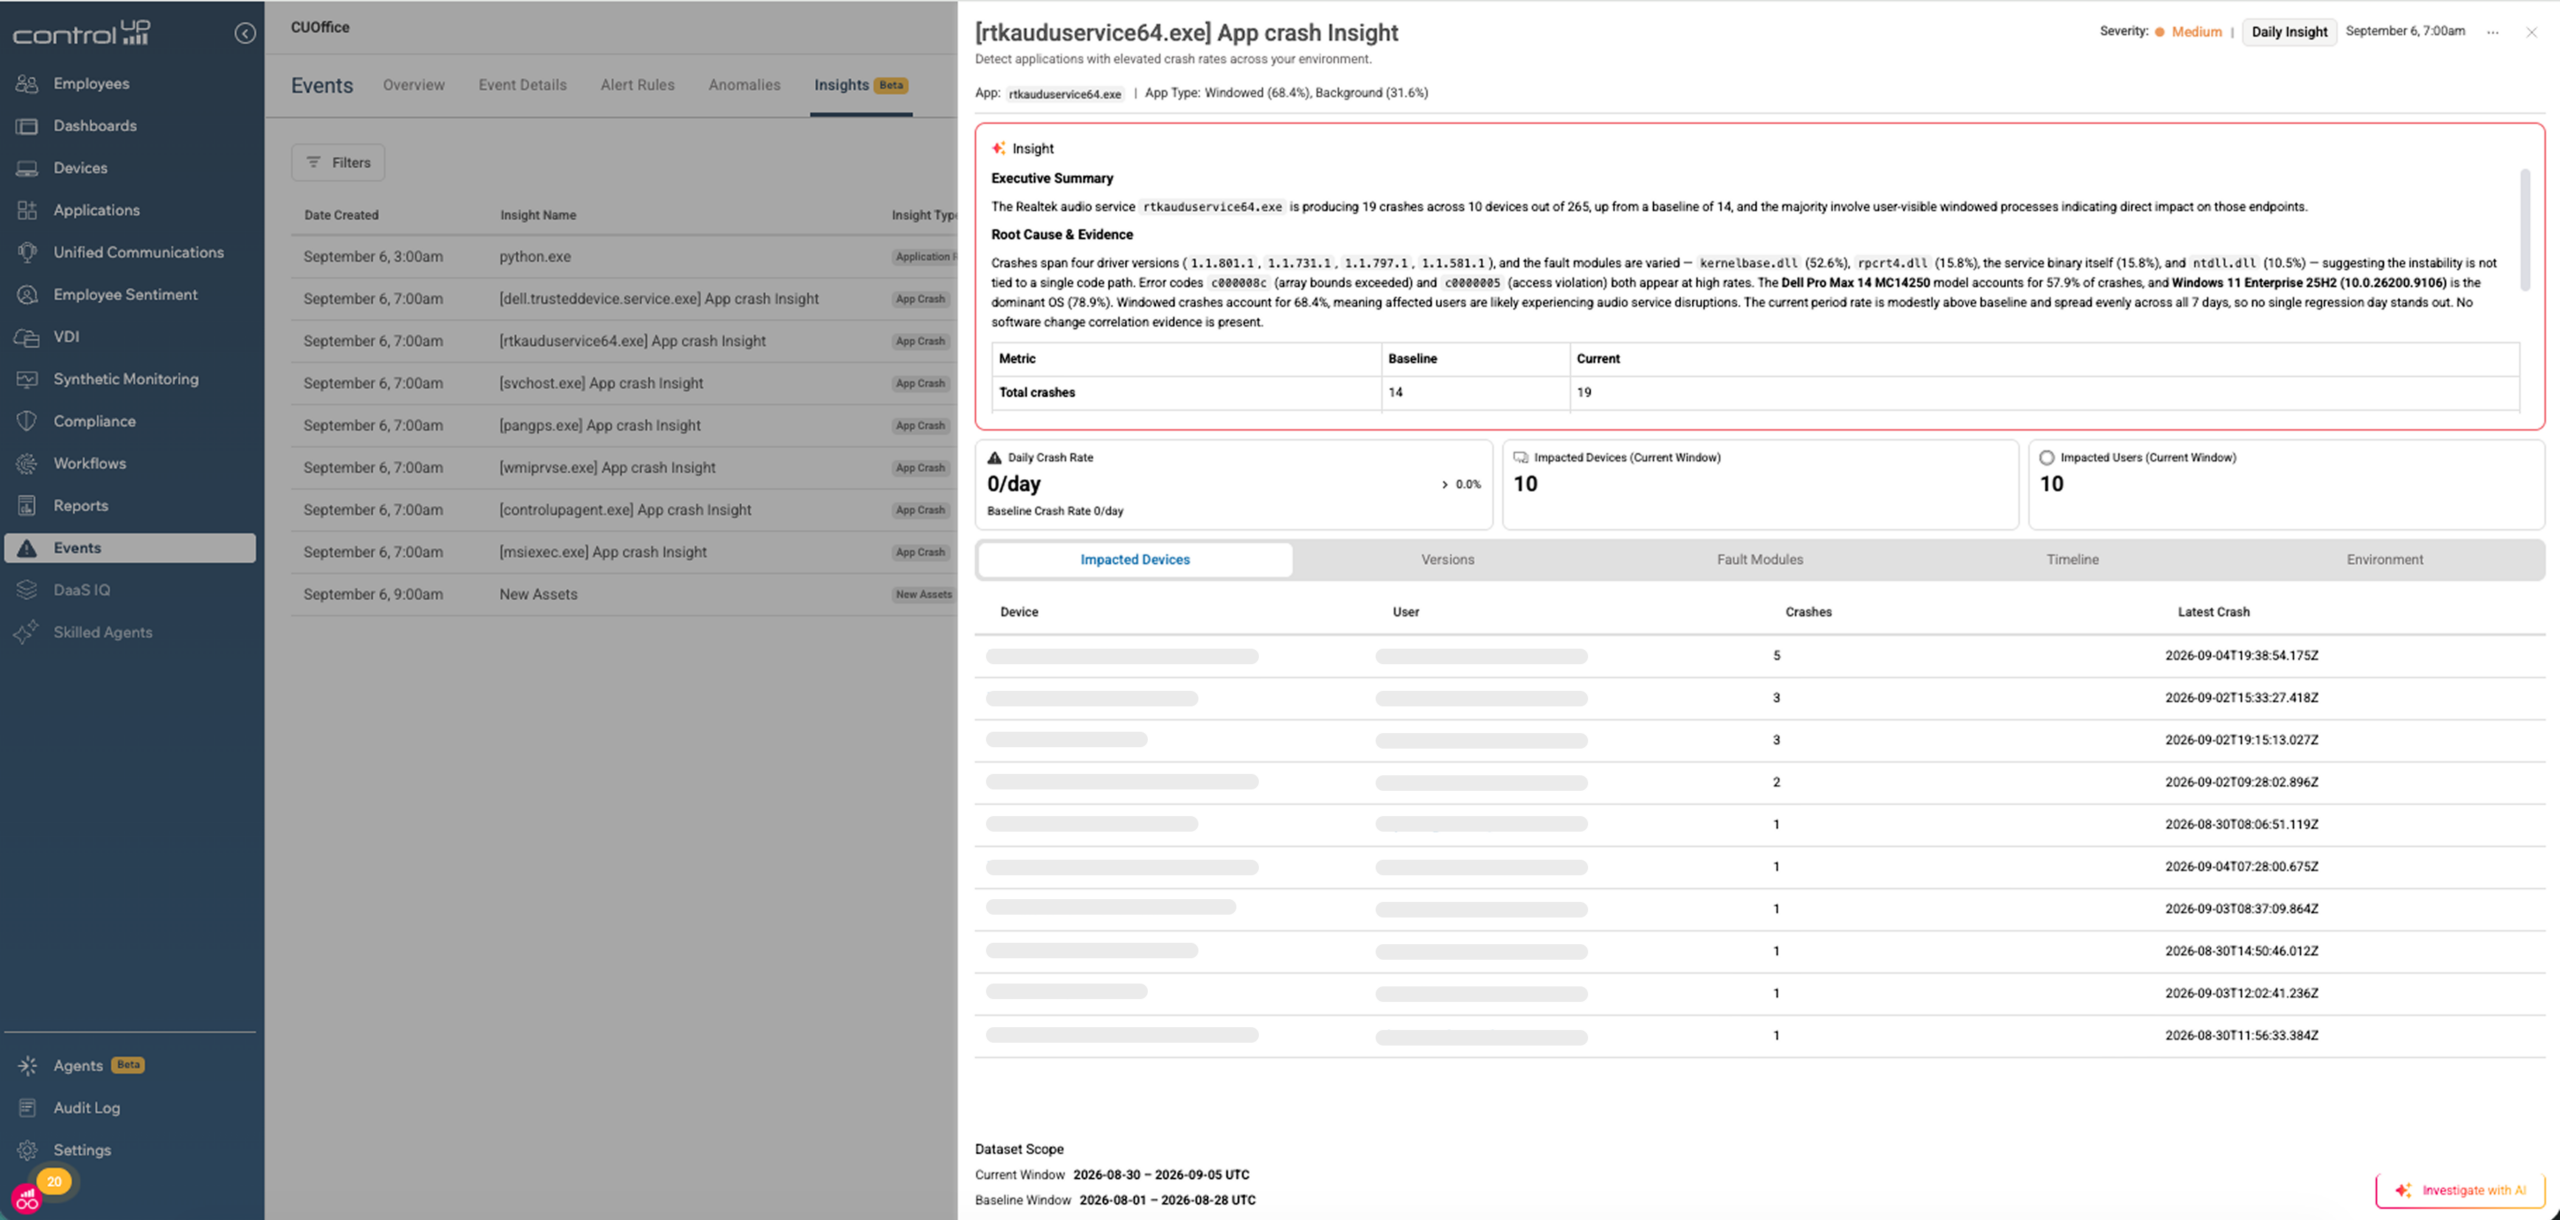
Prioritizing IT Alerts
Pulse Insights runs against your environment on a schedule, daily for operational use cases and weekly or monthly for informational ones and only surfaces something when a use case finds something worth reporting. No findings can mean nothing is wrong, not that the system missed something.
When a finding is significant, Pulse Insights adds the context IT leaders need to act with confidence:
- Severity-ranked, so leadership can see immediately what needs attention first
- Environmental correlations, connecting a finding to what changed elsewhere, such as a driver or software update
- AI-generated summaries and recommended next steps, cutting investigation time
Historical tracking, so patterns are visible over time, not just single incidents
Take App Crash, one of the current use cases: it analyzes the previous 28 days of crash data, establishes a daily baseline, and compares it against the most recent day. When crash volume deviates from that baseline, Pulse Insights does not just flag the application; it looks for what else changed on the affected devices, such as a Chrome or NVIDIA driver update, surfacing a correlation that would be difficult to catch by hand.
The result: fewer things competing for attention, and more confidence that what does surface is real.
Use Cases Available Today
Pulse Insights is available now with five ready-to-use use cases, each targeting a common source of operational drag:
- App Crash: baselines crash volume by app version and flags deviations, including correlated device changes
- BSOD: daily detection of blue-screen events
- Application Resource Consumption: flags abnormal resource usage by an application
- Adobe Creative Cloud Usage: monthly visibility into license usage and adoption
- New Assets: surface newly introduced devices, apps, or websites
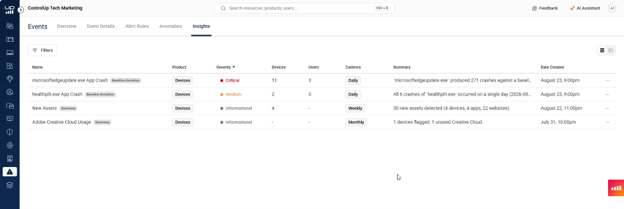
Each use case answers questions IT leaders already ask their teams: Is this problem growing, and where is it coming from? It delivers answers without waiting for a manual investigation.
Each insight includes the same essentials: severity, supporting metrics, affected devices and users, and a recommended next step, with PDF and CSV downloads for sharing outside the platform.
For example, an App Crash insight might show that crashes increased sharply after a browser update on a specific device group. A BSOD insight might identify a cluster of blue-screen events tied to the same driver version. A Creative Cloud Usage insight might reveal underused licenses that can be reassigned before the next renewal.
Reducing Alert Fatigue and MTTR
For IT leadership, the payoff is not just fewer alerts; it is efficient operations. By reducing the time teams spend manually searching for what matters, organizations using Pulse Insights can expect gains in:
- Mean time to acknowledge
- Mean time to resolve
- On-call interruptions
- Ticket volume caused by alert noise
Every hour not spent hunting for a needle in the data is an hour spent on higher-value work, and every reduction in noise builds more trust in the platform.
The same model extends to MSPs, who can use Pulse Insights as a centralized way to monitor findings across every tenant they manage, rather than checking in on each environment one at a time.
The Pulse Insights Roadmap: What’s Coming Next
Future capabilities include:
- More use cases across the platform
- Alerts based on specific insights or severities
- A daily digest of relevant findings
- Integrations with other ControlUp offerings, connecting a finding directly to the tools used to act on it
The direction is consistent: less time spent looking for problems, more time spent solving them.
This is what proactive IT should look like: not more dashboards, but a system that already knows what deserves your attention.
