
 Caroline Howe
 ControlUp's Synthetic Monitoring proactively detects IT infrastructure and application issues by simulating user activity, preventing costly downtime and improving the digital employee experience.
The system uses "Scouts" (simulated tests) run from "Hives" (testing locations) to continuously monitor Virtual Desktops (EUC), core Infrastructure, and SaaS Applications, identifying problems like logon failures or performance degradation before real users are impacted.
It provides granular insights through detailed performance metrics, session screenshots, and customizable alerts, empowering IT teams to swiftly diagnose and resolve issues.
Integrated into ControlUp ONE, the solution complements real-user data, offering a unified view of the digital employee experience and ensuring critical systems remain available and perform optimally.
It’s 8 AM at a bank on the busiest business day of the month. Branches are opening, tens of thousands of tellers are signing in to the core banking platform through the same virtual desktop infrastructure — and not one of them can get through. Every IT dashboard, however, is green: hosts up, network clean.
That’s the tricky part of monitoring: most of it relies on someone experiencing the problem first. Even agent-based monitoring only reports on activity a person triggers — it can’t see the gateway failing logons at 4 a.m. or the app that takes 40 seconds to load from an office with no devices. The employee becomes the detection system, and every problem found that way has already cost someone time and money. This is the digital employee experience eroding, one discovered incident at a time.
The Antidote To Sometimes-On
Synthetic monitoring is the antidote to “sometimes-on” problem detection. Instead of waiting for a person to hit an issue, it simulates what a real user would do — around the clock, against gateways, network services, and applications, as often as every minute for web apps and infrastructure, and every five minutes for virtual desktops. Most importantly, it tells IT whether a solution is working right now.
Why We Built This
In some environments, the logon path is the business. A bank where tellers can’t sign in isn’t having an IT problem — it’s closed. ControlUp built its synthetic monitoring solution in 2020 for exactly these environments, and it’s become core infrastructure for healthcare and financial services customers running VDI and desktop estates. It’s light, it deploys in days, not months, and it’s included in our desktop and VDI offerings.
Check out our Synthetic Monitoring video here.
How ControlUp Synthetic Monitoring Works
ControlUp calls its simulated tests Scouts. Pick a category — EUC, Infrastructure, or Application, pick a type, point it at a target, and set an interval. Each run sends metrics to the cloud backend for visualization, analysis, and alerting.
The locations Scouts run from are called Hives, and where you test from changes what you find:
- Cloud Hives are hosted and managed by ControlUp with no setup on your side. We offer 13 locations across North America, South America, Europe, Africa, and Asia-Pacific. You can use them for anything publicly reachable.
- Custom Hives run on infrastructure you own and reach internal resources. Cloud Hives can’t (Windows is GA; Linux is now in beta). They keep test credentials on-premises and work around gateways where MFA makes automated logins from the public internet impractical.
Tags apply to both of these, and custom roles scope permissions by tag — the EUC team owns EUC Scouts, the network team owns theirs.
And, critically, for anything you’re evaluating, nothing changes on the target side. That’s what makes synthetic testing viable against public cloud services and internal systems you don’t control.
Use Case #1: Know your virtual desktops work before anyone logs on
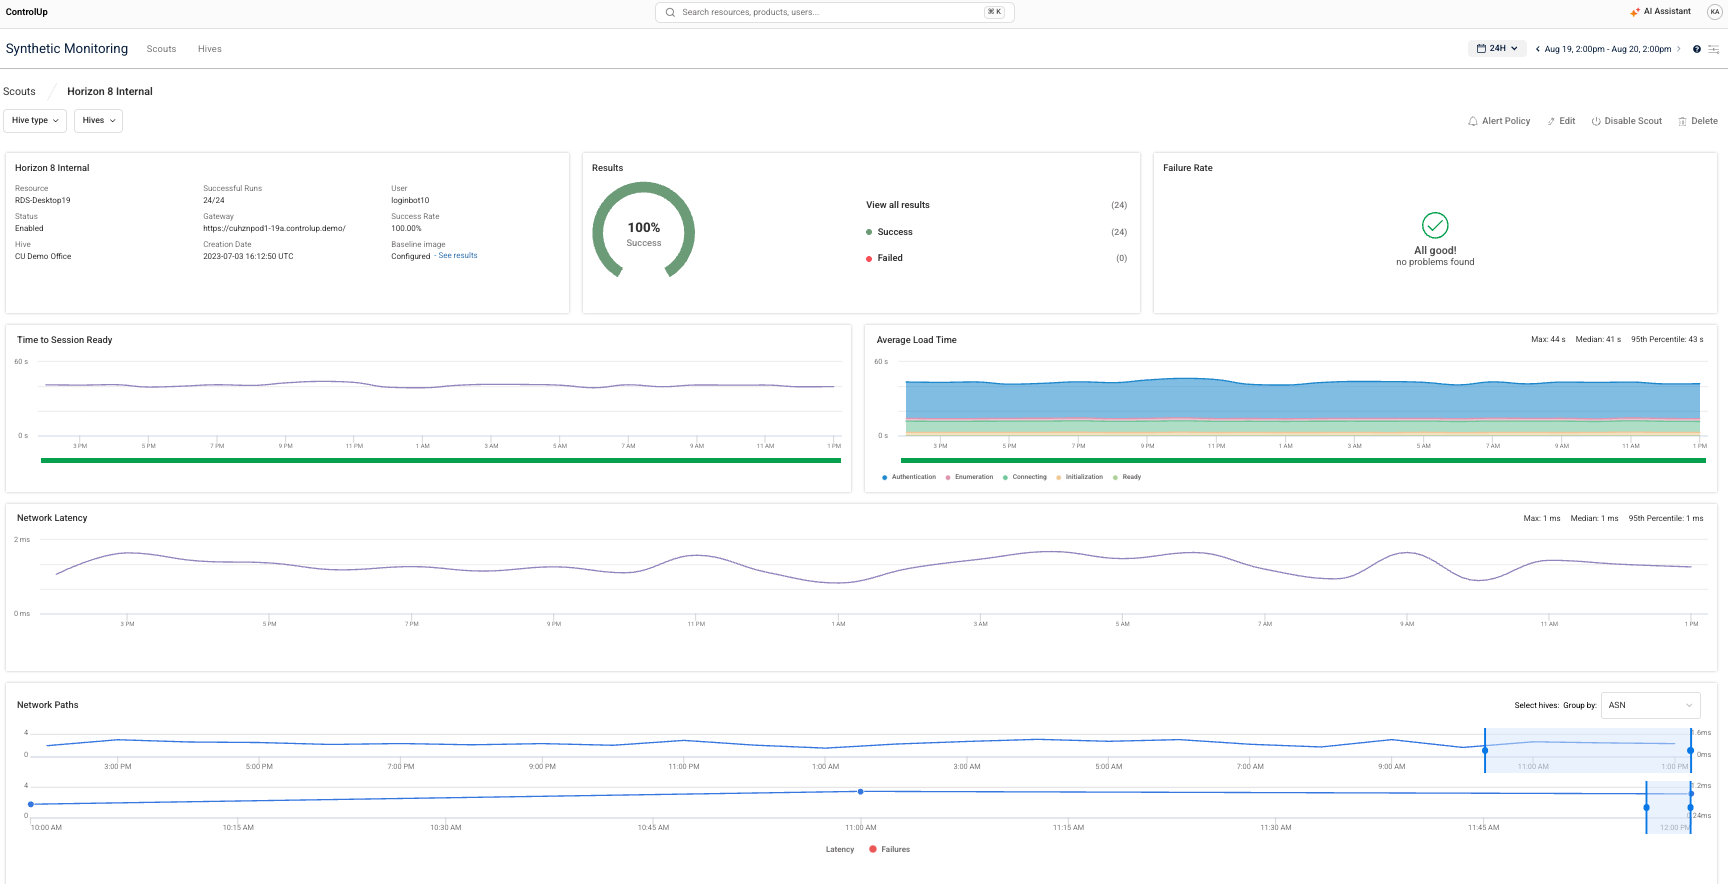
If you deliver virtual desktops or published apps, the path into your environment — broker, gateway, enumeration, session ready — is invisible to you whenever it’s empty. EUC Scouts complete that full transaction on a schedule: authenticate, enumerate, launch, wait for ready, log out. Before anyone starts work, you already know whether they are able to access.
 Supported gateways are:
- Microsoft Azure Virtual Desktop, plus Windows 365 Cloud PCs via the AVD gateway (both use the same infrastructure)
- Citrix Cloud Gateway Service, CVAD–NetScaler Gateway, and CVAD–StoreFront (Custom Hive only, requires WebSocket connections enabled)
- Omnissa Horizon Connection Server/UAG, Omnissa Security Server, and VMware Workspace ONE
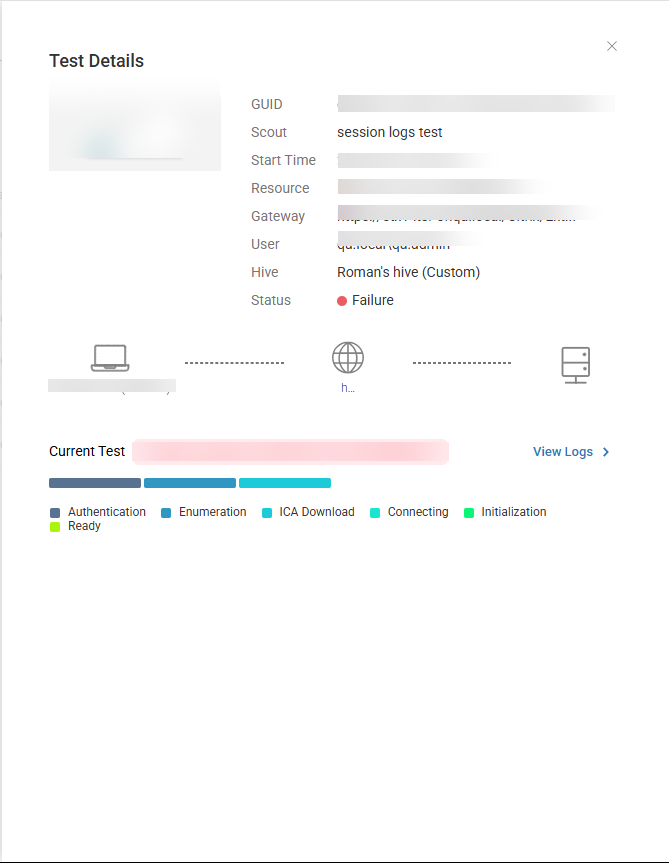
The overview shows health across every remote desktop environment on one page — uptime, time to connect, time to session ready, average response time, and connection success rate. It also offers a drill-in for per-phase breakdowns, network latency, hop-level path detail, and a session screenshot from every test, successful or failed.
Three capabilities are worth calling out:
- Baseline session screenshots: Set a known-good screenshot as the baseline. Every test returns an Image Anomaly Score—a percentage of similarity. Alert on it, and you catch the session that technically opened but landed on an error dialog. A successful launch and a usable launch are different things.
- Native client testing for Horizon: UAG Scouts default to the web client. On Custom Hive 1245+, set Use native client to Yes and test through the Omnissa Horizon Client instead, including SSO flows. If employees use the native client, test the native client.
- Authentication that matches production: Okta, Duo, Ping Identity, and Entra ID as identity providers; Static PIN, TOTP, SMS, and voice call MFA for EUC Scouts; SAML SSO with Okta against Citrix and Omnissa gateways
For Citrix environments, run the Scout from a Custom Hive, and it collects session data from your on-premises Delivery Controllers — logon duration, ICA RTT, GPO processing time, profile load duration, brokering duration, hosting server, delivery group, and catalog name. The same per-phase detail you’d get from a real session, from a session no employee had to suffer through.
A typical use case is migration validation. Windows 365 Cloud PCs are monitored through the AVD gateway, so you can validate logon time, availability, and errors on a Cloud PC pilot with zero employees assigned to it. Test the destination before you move people to it — that’s a much better conversation than testing it with the first wave of migrated users.
Use Case #2: Answer “Is it them or is it us?” without wasting time
The single most expensive question in a service desk queue is is it them or is it us? Endpoint data tells you the device is healthy: CPU is fine, network is fine, no blue screens. It cannot tell you whether the thing that the device connects to is healthy.
Infrastructure Scout types are:
- Ping (availability, round-trip time) and Traceroute (hop-by-hop routes)
- DNS Lookup (resolver availability, response time, correct records)
- HTTP/S (web service connectivity)
- Microsoft Entra ID (connectivity to login.microsoftonline.com via OAuth or app registration — supports 1-minute intervals for the first 10 minutes)
- Shell Execution (any command you define, from a Custom Hive, with configurable exit code ranges and STDOUT capture)
Run these from Custom Hives in the same locations your devices live, and you get the other half of the them-or-us answer. If you see that the device and gateway are fine, then look at the user’s home network. If you see that the device is fine and DNS resolution jumped to 800 ms from that office, then stop troubleshooting the laptop.
Shell Execution is the escape hatch: when the check you need isn’t a Scout type, script it. Shell output can be attached to alert emails as a .txt file so the diagnostic arrives with the alert. Files over 5 MB aren’t attached, and the email carries a “may contain sensitive information” warning — know that before enabling it.
Use Case #3: Catch SaaS degradation before employees report it
Real-user data shows you page load performance and errors from devices where people are actively working. What it can’t show you is the app when nobody’s using it, or from a location where you have no presence — which is exactly when and where you want to catch a degradation.
Application Scout types are:
- Web Transactions — This simulates a workflow rather than a page load. In up to 50 steps, you can click, insert text, press key, wait for a condition, assert on text, hover, enter and exit iframes, and switch tabs. You can record interactively with the Chrome extension or configure manually with CSS, XPath, or JS path locators. MFA is supported as a step type (SMS, voice, TOTP, static PIN), offering one per Scout. The results include a screenshot at each step, plus page-load metrics such as First Contentful Paint and DOM Interactive.
- Microsoft Teams — This offers two tests per cycle: an HTTPS request to the Teams network edge, and a call quality test against the relay server measuring packet loss, jitter, and latency. UDP over port 3478 first, falling back to TCP over 443. We offer the ability to set your own packet loss threshold and whether the Scout fails on either test or only both.
- Mail Application — This tests Exchange Online in both directions, reporting total delivery duration, with incoming tests separating hop-by-hop delivery from server processing time so a mail delay is attributed rather than guessed. We offer the ability to run two Scouts to cover both directions.
- Microsoft Exchange — This offers preconfigured checks against smtp.office365.com (25, 587), outlook.office365.com (993, 995), autodiscover-s.outlook.com, and attachments.office.com.
- Site Load — This breaks a page down by size and time, per content type and per domain, down to naming the specific image or font that costs you 1.7 seconds.
When a Web Transactions test fails, the failure reason names the step — so “the CRM is slow” becomes “step 4, the search field, times out at 12 seconds from London.” The result is that “Salesforce is slow” stops being a report you receive and starts being a threshold you already crossed at 6 a.m.

Use Case #4: Alerting the team won’t tune out
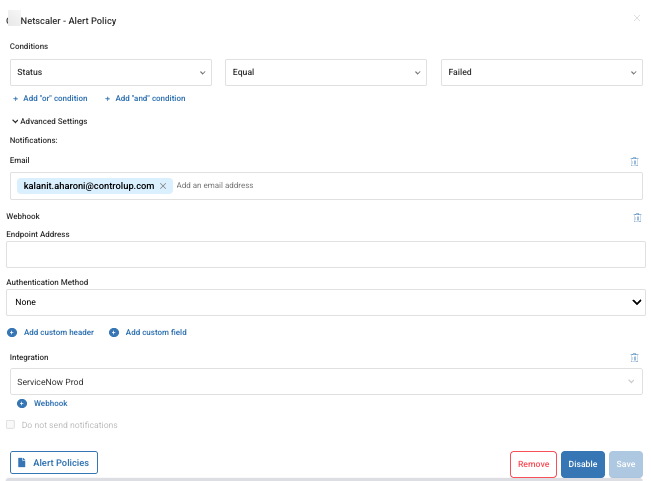
Alerting makes or breaks a synthetic monitoring tool. Alert on everything, and IT stops paying attention; alert on too little, and the outage you bought the tool for slips past. We offer an alert policy where one or more conditions are joined with AND or OR, and two settings do the heavy lifting:
Subsequent tests — Require N consecutive failures before firing, so transient blips resolve quietly
Same hive vs. across all hives — A problem one location sees three times running is a different problem than three locations seeing it once
Choose which you hear about.
Alert conditions by Scout type:
- EUC: authentication duration, resource enumeration, session initialization, GPO processing, RTT, latency, packet loss, jitter, hop count, and image anomaly score
- Infrastructure: connection time, redirect time, TLS handshake, time to first byte, and certificate expiration
- Application: response times, exit codes, failure reasons, response strings, and header values
Alert suppression is on by default for new policies — so customers receive one notification when it triggers, one when it resolves.
Notifications go out via email, a webhook with custom headers and fields, or an integration with ServiceNow or Microsoft Teams. The ServiceNow integration creates incidents with chosen urgency, templated descriptions, and any additional fields you want populated — and you decide whether resolving the alert resolves, closes, or opens a new incident.
Two more pieces of noise control:
Alerts for stopped Scouts. If a Custom Hive goes down, its Scouts stop testing — and silence looks identical to success. ControlUp emails your notification addresses when Scouts stop reporting past their interval, listing which stopped, for how long, and from which Hives.
Maintenance windows. Schedule downtime so planned work doesn’t generate alerts. Scout windows disable specific Scouts; Custom Hive windows stop everything from selected Hives. One-off, weekly, or monthly recurrence, with affected Scouts and Hives flagged in the UI.
Summary
Most monitoring only sees what employees are actively using. The hours nobody works, the locations without devices, and everything behind the login screen go unwatched — and that’s where the expensive incidents start: the 4 a.m. degradation, the expired certificate, the branch office nobody can see.
ControlUp Synthetic Monitoring covers it all. There’s nothing to install on the systems being tested, setup takes days rather than months, and we offer a simple licensing credit model.
It’s included with ControlUp’s desktop and VDI & DaaS solutions as part of ControlUp ONE, so the tests and your real-user data live on one platform and speak the same language. The test that catches the problem at 4 a.m. and the session data that explains the employee experience at 9 a.m. tell one story. If ControlUp is already monitoring your desktops or virtual environment, this capability is sitting next to the data you already have.
And for teams that want to build these tests into their own QA or SLA processes, there’s an API for that.
Get a demo here: https://www.controlup.com/schedule-a-demo/
Trial the product on your own: https://www.controlup.com/free-trial/