 Kalanit Aharoni Girshtel
 ControlUp for Apps offers Automatic License Spend Visibility, enabling IT teams to mitigate significant SaaS waste by providing real-time insights into software license usage and optimization opportunities.
- The feature consolidates all license data, including API-connected services like Microsoft 365 and manually tracked products, into a single platform for comprehensive overview.
- It automatically identifies inactive users and those provisioned with higher-tier licenses than their actual usage dictates, facilitating precise license reclamation and tier downgrades.
- This capability empowers IT to make data-driven decisions, justify software investments, and optimize spending before renewals, reducing costs and enhancing efficiency.
Every IT team knows the feeling: you can see every app your organization uses but you have no idea if you’re actually getting your money’s worth from any of them. You know how many Microsoft 365 licenses you bought but you have no idea how many are actually being used. That gap is expensive. Industry estimates put wasted SaaS spend at 30% of the average software budget, money spent on premium tiers for users who only touch basic features, or seats kept “just in case” for people who haven’t logged in for months. For an enterprise, that’s hundreds of thousands of dollars a year.
ControlUp for Apps announced earlier this year that we are not only offering IT teams real-time visibility into app health and performance, catching slowdowns, outages, and failed logins before they turn into tickets, but we also extended that same visibility to the money side of the equation: what you’re paying for, and what you’re actually using.
Why SaaS Spend Visibility Matters
Software vendors have been raising prices across the board this year. That pressure lands squarely on IT, which is expected to justify every license line item without a clean way to do it. Spreadsheets and vendor admin consoles weren’t built to answer “are we actually using this,” and stitching that answer together manually eats hours IT doesn’t have.
With ControlUp’s Automatic License Spend Visibility capability, the goal is to help IT give a straight answer to “what are we paying for, and is it worth it.” In the same way ControlUp already gives a straight answer to “why is this app slow,” License Spend Visibility closes the gap between license line items and the question of “is this being used?” IT admins get a clear understanding of wasted spend, finance gets a real cost-per-app and utilization view instead of an estimate, and digital experience teams get a way to optimize licensing tiers based on actual behavior instead of making assumptions.
A Single Home for License Data
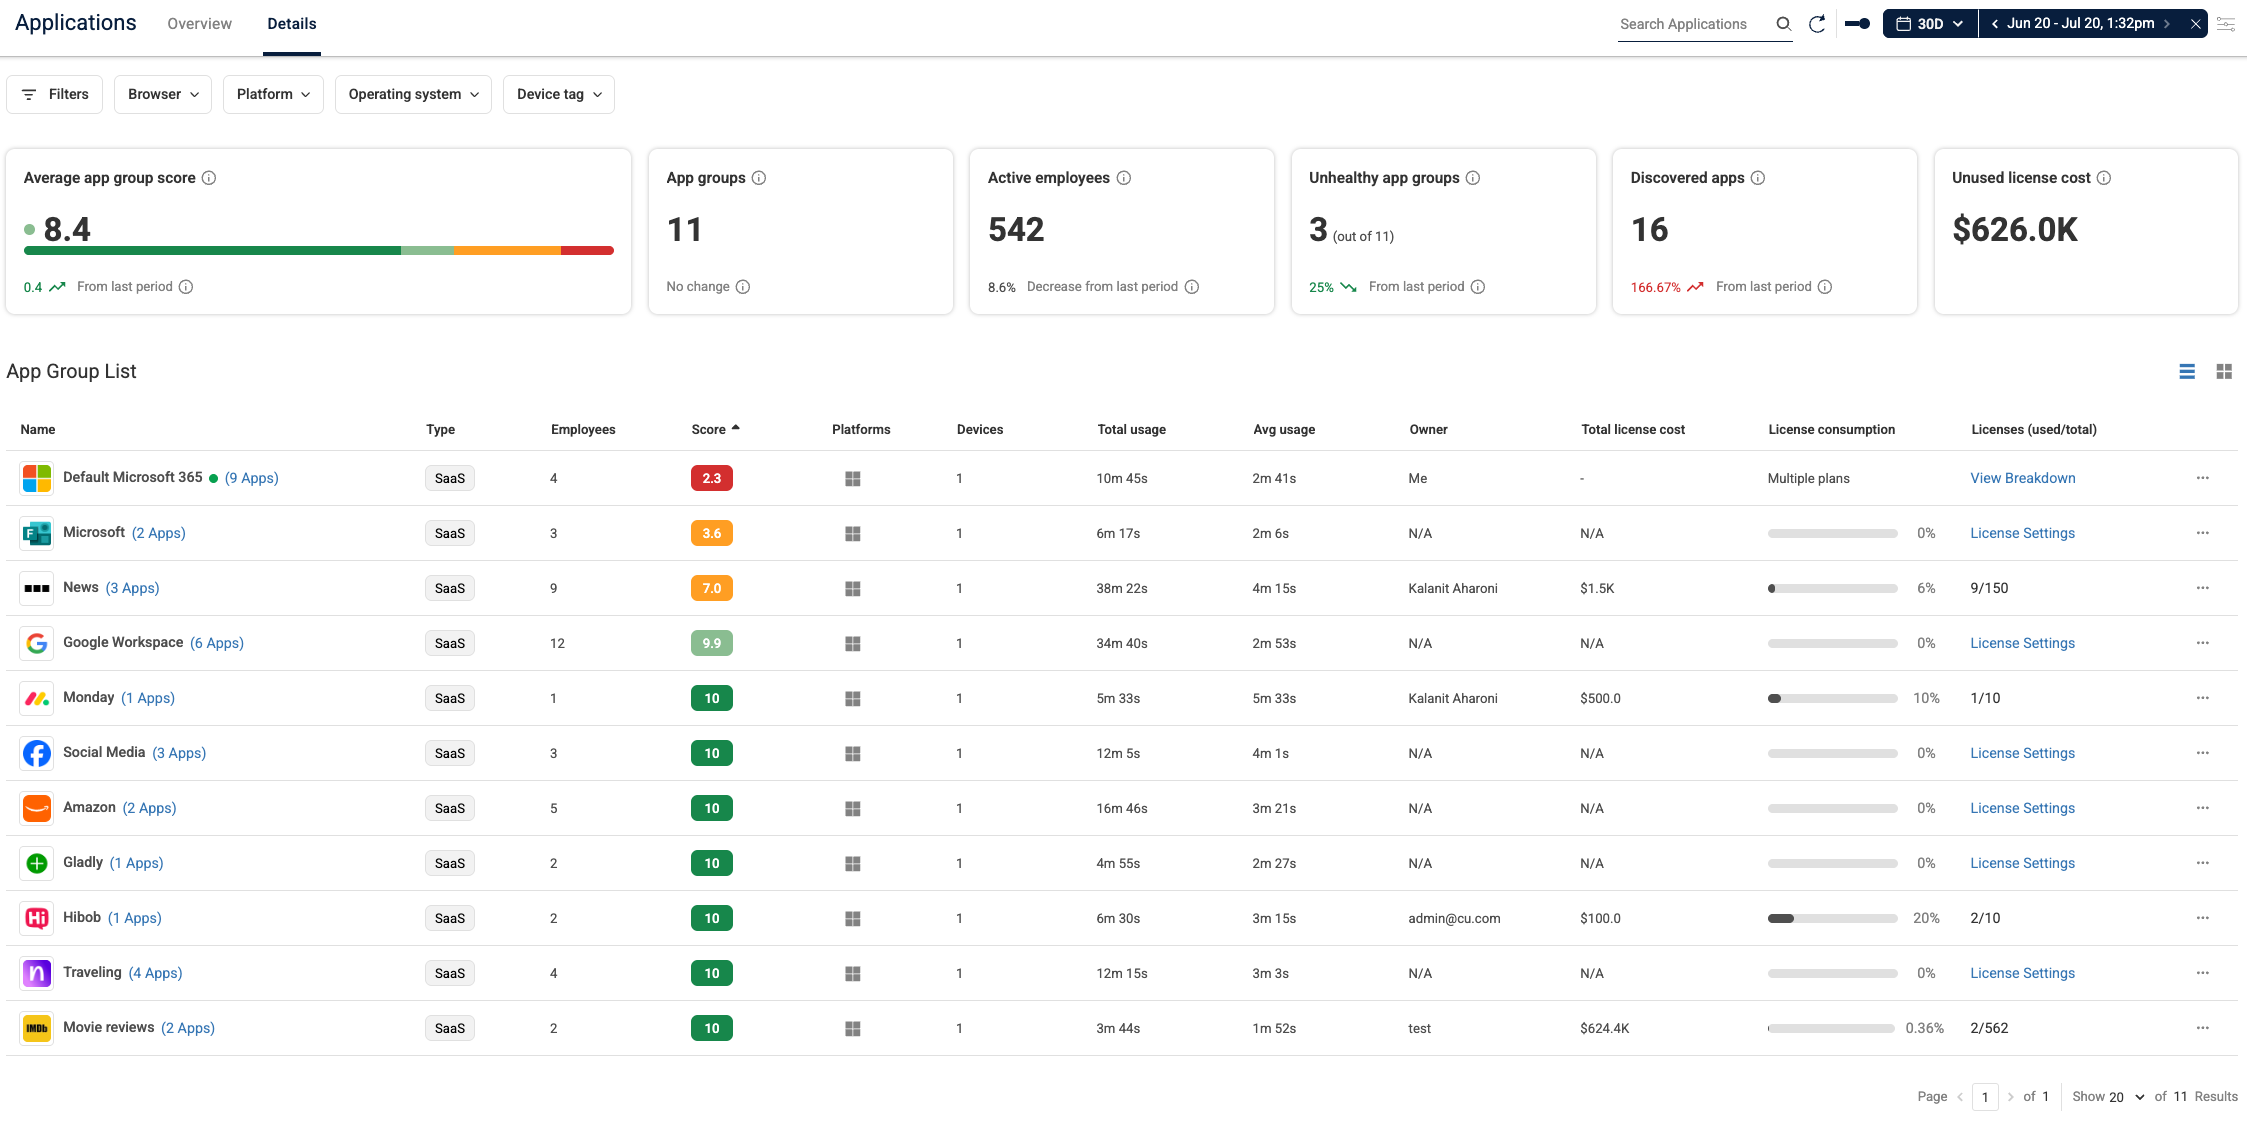
In order to give IT teams full visibility into Apps license data, we offer one single location to find all device usage, cost per license, employee data, and more. We’ve added a top-level Licensing tab to our Apps module in the ControlUp platform so there’s no need to dig through App Groups trying to remember which one has your license data. API-connected products like Microsoft 365 show live data and manually tracked products like Adobe, Slack, Zoom, and Atlassian sit right alongside them.
Real usage data without guesswork
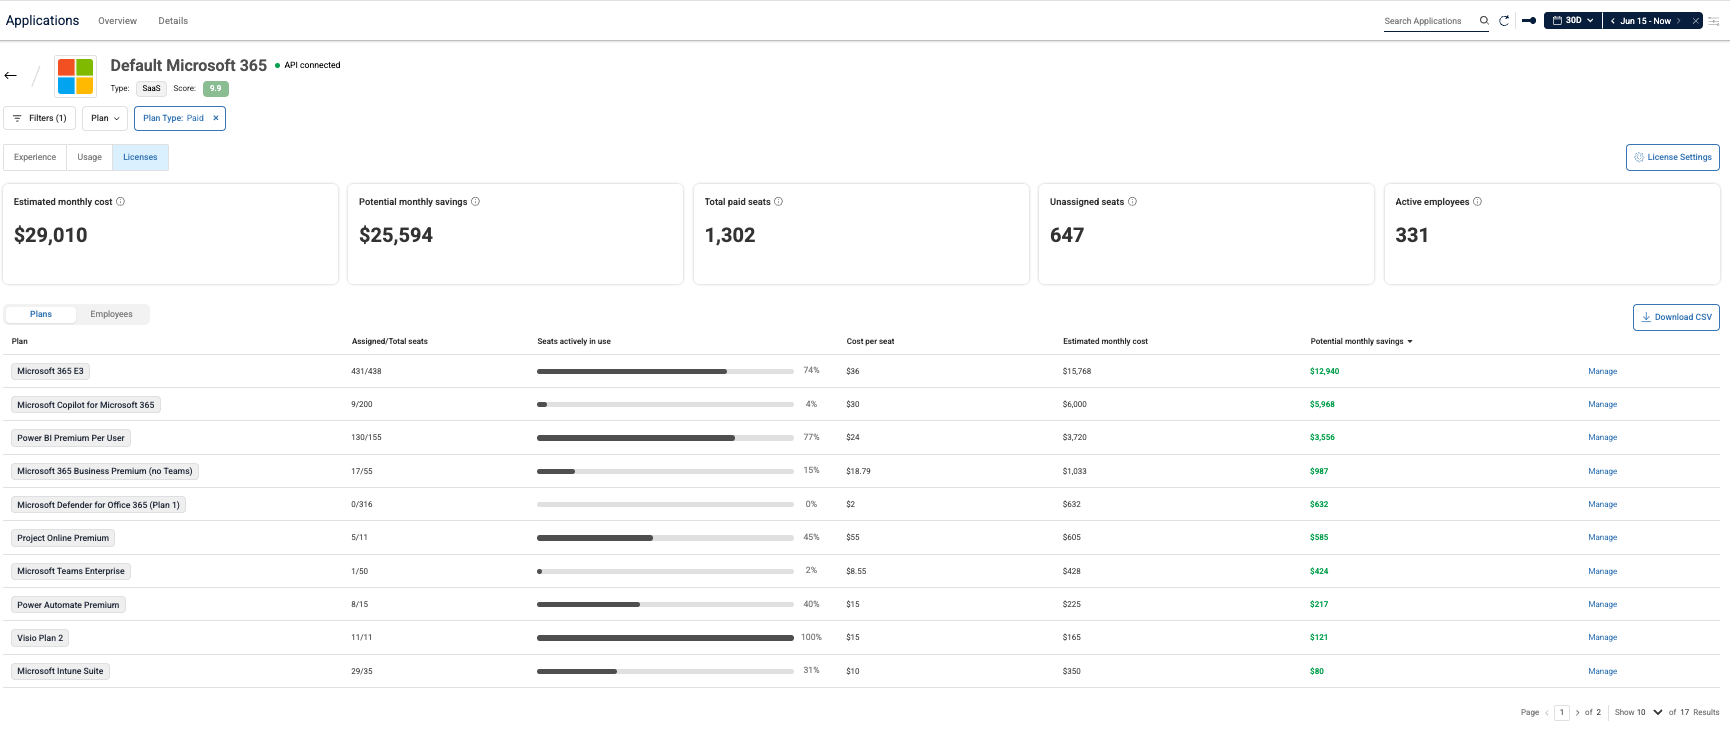
One example of our SaaS spend initiative is an app most IT teams manage but few have full insight into the spend associated: Microsoft 365. Once connected via Workflows, ControlUp pulls license and activity signals directly from the Microsoft Graph API. You’ll see total seats, monthly spend, unassigned seats, and, critically, which licensed users have gone quiet. Anyone with no Microsoft 365 activity in the last 30 days will get flagged as a candidate for reclamation.
 Right-size before you renew
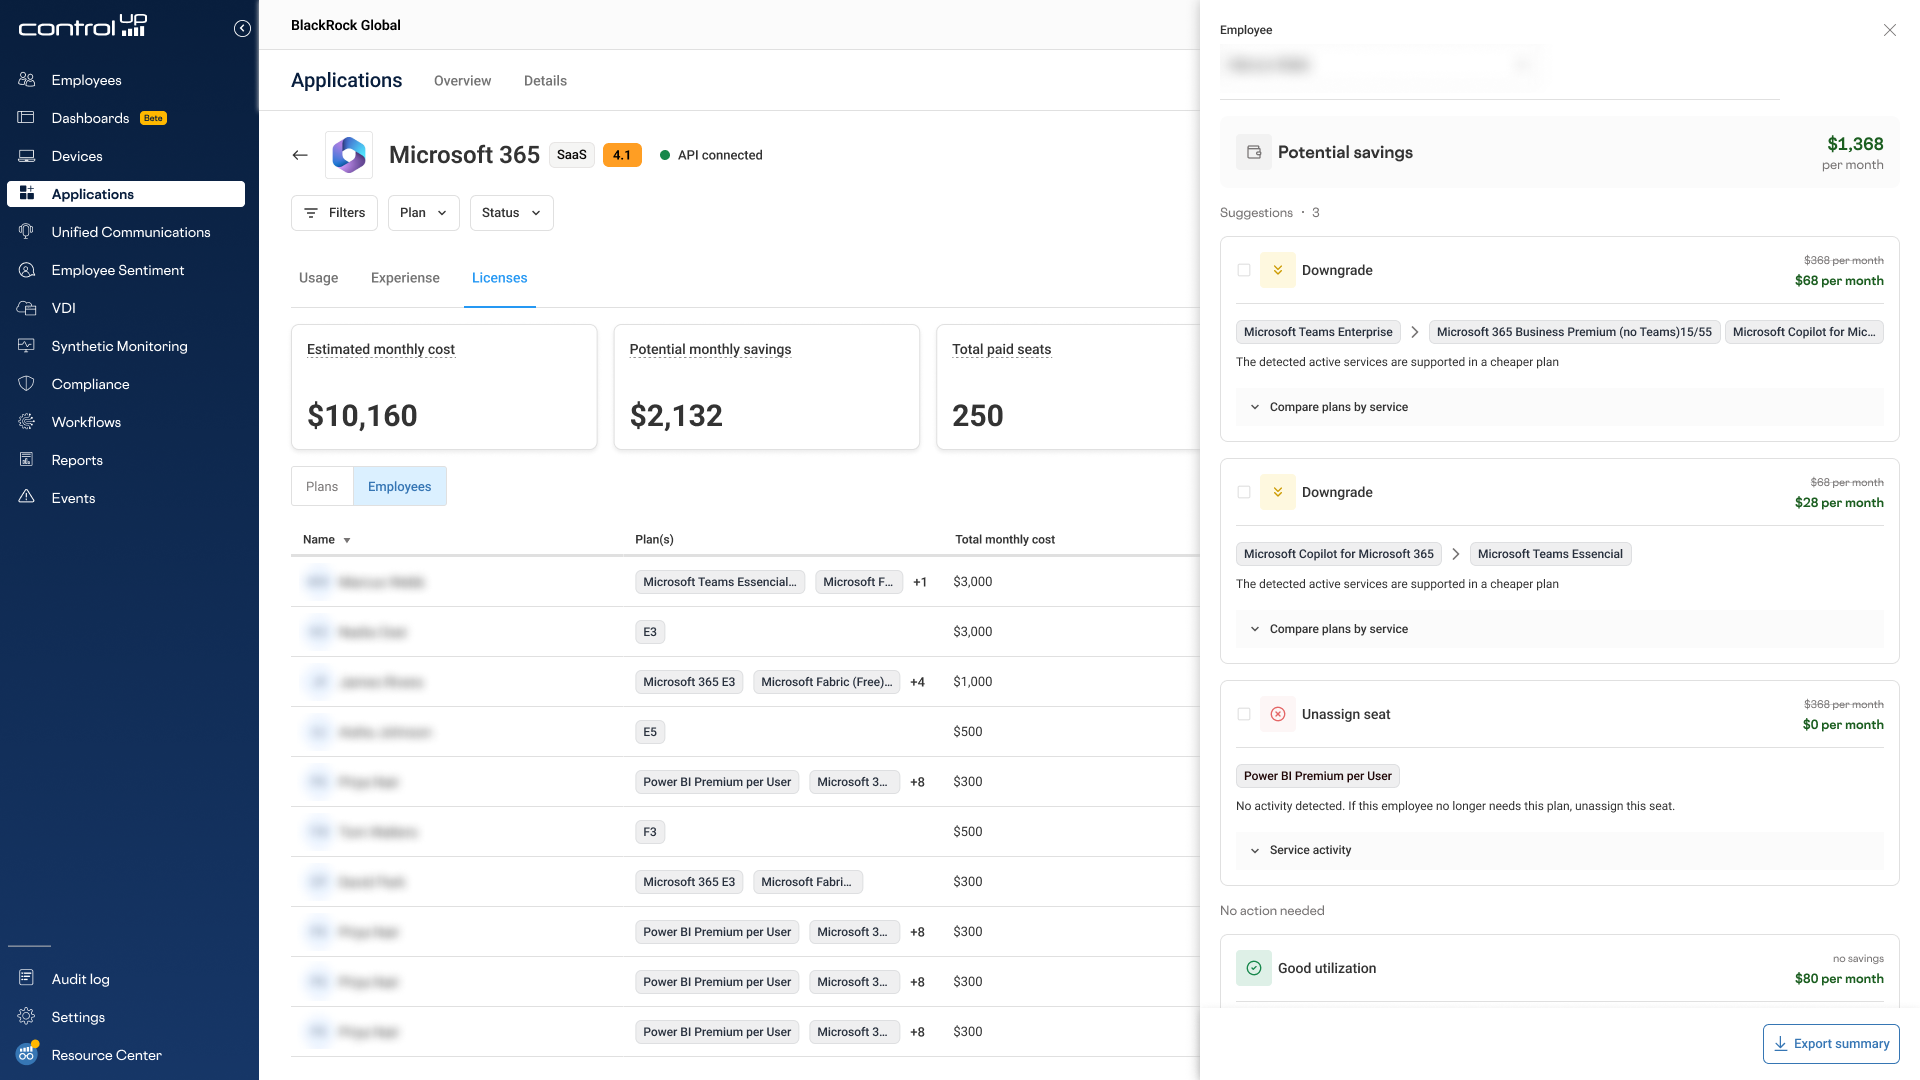
Beyond who’s inactive, we’ve also built visibility into who’s over-licensed. Users who are on premium tiers like E5 while only touching E3-level features will be easy to spot. That means you can walk into your next renewal knowing exactly where to downgrade instead of guessing.
More Visibility, Less Guesswork with ControlUp ONE
License visibility runs on the same premise as the rest of our platform: help IT make informed decisions. That’s the throughline across ControlUp ONE, whether you’re looking at a VDI session, a managed desktop, or a Microsoft 365 seat. We aim to offer IT more certainty, less guessing, and less reacting, so more of IT’s day is spent on decisions that actually move the needle.
See it in action. Get a personalized demo or explore ControlUp for Apps to see how real-time monitoring and license visibility work together in one platform.